Few Debugging things unleashed:
Being a software developer the debugging thing is the skill that used to debug the code and find the holes.
Visual Studio itself provides a good intellective debugging support. But a few shortcut keys can make debugging faster, more accurate and more helpful to find what's happening behind the scene.
QuickWatch or Watch - You want to see what's value of a variable or any objects properties or you want to change the value of a variable/property or any thing. Select the Object or the expression and right Click and click on Quickwatch or Watch.
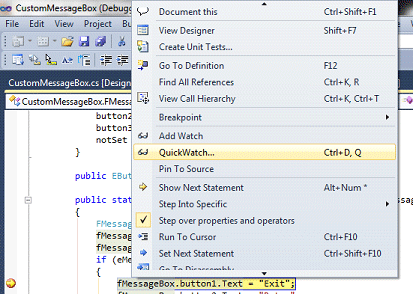
You'll see the below window.
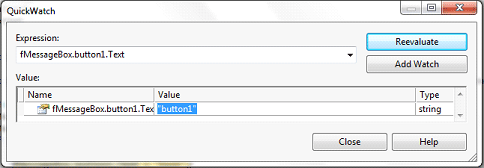
Now change the value field and click on Reevaluate or simply hit Enter key. The field value turns red, indicatng that your value is updated.
There's much more you can do with the Watch window. Go and explore it.
F5 - Here you start your debugging with your project. Or if you have place any break point and want to continue the execution.
F10 - If you want to see which lines of code are being executed. Then press place a break point somewhere in the code and when breakpoint hits press F10 to see the line by line execution.
F11 - Use it when your statement is a function call and you want to go inside the function to see what's happening. Press F11 to drill down the execution. Once the execution of the function is over the cursor will return back to the call statement.
Shift+F11 - Going forward with F11 thing, if you want to go back to the call statement immediately from the function body. Then press Shift+F11.
F12 - Just want to go to the definition or Declaration part of any Variable or Class or Function.
Tool Tip Window - Well this the common thing you see when you debug your application using Visual Studio. Just place your mouse cursor over the statement and it'll show you the values, properties or all runtime info as tooltip.
BreakPoint - when you want to pause the execution and see the run time things in your code. Just click on the left most bar and a Red ball will appear.
Lets talk about the BreakPoints:
Conditional Breakpoint: Suppose you have a loop and it's iterating for let's say 500 times. Then you want to check the value at particular time when the loop is iterated 100 times. Here 's the best way of achieving this. Right Click on the Red Dot
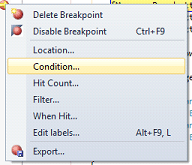
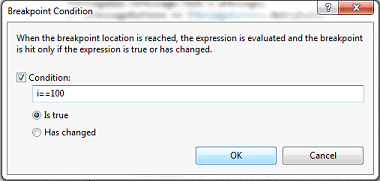
Here i is the looping variable. Now what's gonna happen the Break point will only hit when I have value 100. Also your Breakpoint dot will have a '+' sign and will look like this

There's more option available to change the behavior of a breakpoint Location, HitCount, Filter, WhenHit.. and EditLabels (To name your breakpoints) etc.
Just go and explore them what they do and how your breakpoint behavior changes.
More over you can control the Flow of execution by using the option SetNextStatement or by just moving the Yellow marked arrow to any statement you want to execute next. Just click on yellow arrow and drag and drop it on any statement.
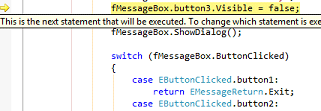
Alternatively if you want to execute a particular statement by skipping a few line of code or want to go back to the previous statement to re-run their execution then just right click on the target statement and select "Set Next Statement"; see screen below.

Suppose you have opened many files at a time in the Visual Studio and you are debugging your application. And you have scrolled down in a file having 2000 lines of code and forget where my debugging cursor was, to go back to your next executing statement just right click any where and select "Show Next Statement".
Immediate Window: As the name indicates, if you want to execute your statement while debugging then open the Immediate window from Debug->Windows-> ImmediateWindow and write you statement in it and hit enter. It'll execute the statement and will show you the output.

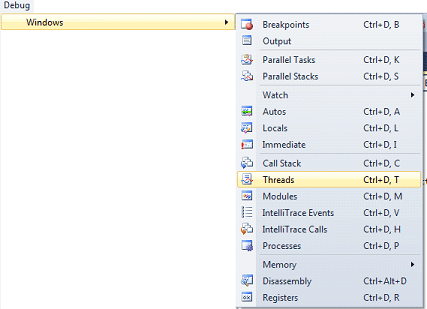
Now in Debug->Windows you can see many options to see the runtime information.
CallStack - To see subsequent calls to the functions.
Modules - What modules are currently loaded in the process etc.
The last and very useful feature in visual studio while navigating in the code from here to there.
Navigation Backward and Navigation Forward - Now before I wrap up the last important thing you can use to quickly return to the last place. Visual Studio remembers your last place you were in your code. If you don't see the blue arrow icon as shown below then go to View-> Navigation Backward and Navigation Forward option.

Well I do enjoy with these features of Visual Studio while debugging. Hope who are new to Visual Studio will enjoy this article.
Happy Debugging :))