Abstract:
Using this application a user can generate a report of test case execution from QC (Quality center) as a HTML web page with fancy pie chart and tabular format using C# and OTA API expose from QC (Quality Center).
Introduction:
Before jumping to the main point let me explain that there are so many articles available on the internet about generating Test cases execution reports using VB .Net but for C# there is very little information. This application I have developed using C# .Net. In this application you will get the ability to generate a report as a HTML web page
from QC and the HTML page would contain a pie chart of test cases executed with tabular format; you can even email this report to all your team members. Apart from that you can store the result back to QC location for future use.
What are the new features I have provided?
This application is a whole bundle of a package, just one exe run and the result will be in your inbox. Using this you will be abled to:
- Generate test cases report.
- Draw Pie chart based on report
- Store the result in HTML webpage
- Email this report using any email service provider (like outlook etc..)
- Save the result to local hard drive or back to QC location.
- Early morning manager ready with the report.
Refer to the graph below for the best explanation:
Fig 1. QC data Puller Diagram
Implementation:
I have used the C# programming language to develop this. To talk with the QC I have included TDAPIOLELib dll Provided by mercury labs. We have used a console application from Visual Studio IDE to develop this application so that we can easily schedule this with the Windows scheduler for regular execution on a schedule. To store all the settings and input values I have used an app.config file to store the configuration data. Overall I have used a very easy and direct approach to achieve my task so that even a C# beginner can understand this.
The HTML report will appear something like this:
Fig 2. HTML web page as report
Background:
As I am more interested in C# automation and I m not very good in VB script and in QTP, I thought to use C# for this purpose and there is even not so much help available on the internet for OTA of QC for C# .Net and working in a big organization the higher level people would be more interested in data and fancy reports irrespective of your oral conversation and they are more likely to trust a report. There was very less information available on the inernet to use QC client API using C#. So I decided to also attract C# developers towards the QC API report and hopefully in the future there will be enough information available on the internet.
At last but not least this is my small effort to achieve this.
What is OTA API?
You will get loads of information available on the internet for the same. Just Google or Bing it; you will get enough information. But still I would prefer to give you some basic information for it.
The Open Test Architecture (OTA) API is a COM library that enables you to:
- integrate external applications with Quality Center
- interact with the Quality Center application without having to use the GUI front-end
- interact with the QC databases bypassing DBA
- The API functions are accessible through COM-compatible programming languages, such as Visual Basic, VBScript, C++, C#, etc.
- The API has one entry point - TDConnection object
Fig 3. OTA Object model
Use the Code:
Part 1: App.config
Before going deep into the code I would love to explain the App.config file which I have used to store all the inputs settings. So you will get an idea of the prerequisites:
<?xml version="1.0" encoding="utf-8" ?>
<configuration>
<appSettings>
<!-- QC server location to access the QC website-->
<add key="QCserverURL" value="QCServerURL"/>
<!-- QC domain name -->
<add key="QCdomainName" value="domainName"/>
<!-- the name of the project for which you want to retrive the test case execution report-->
<add key="QCprojectName" value="projectName"/>
<!-- user name through which you have to login in to QC-->
<add key="username" value="USERName"/>
<!-- Password to login in to QC-->
<add key="pwd" value="password"/>
<!-- Folder names provided in to QC from which you want to generate report. multiple location shoudl be seperated by semicolon(;)-->
<add key="QCFolderLocationForTestCase" value="Root\Integration Team\ eprint;Root\Integration Team\ apps"/>
<!-- the title of the pie chart, will be appear before putting the graph-->
<add key="ChartTitleForTestCasesReport" value="eprint ; Sips"/>
<!-- location where you want to store all the pie chart generate by code-->
<add key="locationToSavePieChartImages" value="C:\QCReportImages\"/>
<!-- Test case status names-->
<add key="TCStatusNames" value="Not Completed;No Run;Failed;Passed;Accepted Failure;Blocked;N/A;Repair;Unsupported"/>
<!-- location to store the HTML file or report generated-->
<add key="htmlWebPageLocation" value="C:\\QcReportIntegrationTeam.html"/>
</appSettings>
</configuration>
I hope you have gotteb an idea of all the inputs you need to provide before using this application.
Part 2: Main Program
This will be our sample to use for working as per our requirement or how we want to handle the code to work for us.
Declaring Namespace:
using System;
using System.Data;
using System.Configuration;
using System.Web;
using System.IO;
using System.Threading;
using System.Diagnostics;
using System.Net;
using System.Drawing;
using System.Drawing.Drawing2D;
using TDAPIOLELib;
To add TDAPIOLELib name space follow the steps below.
- Go to your solution explorer
- Click on References
- Select add references
- On opening window clicked on Brower tab
- Go to the location C:\Program Files\Common Files\Mercury Interactive\Quality Center
- Select OTAClient.dll and click on Ok button, if you don't have OTAClient.dll then you has to download it from web.
Refer to the figure below for the details.
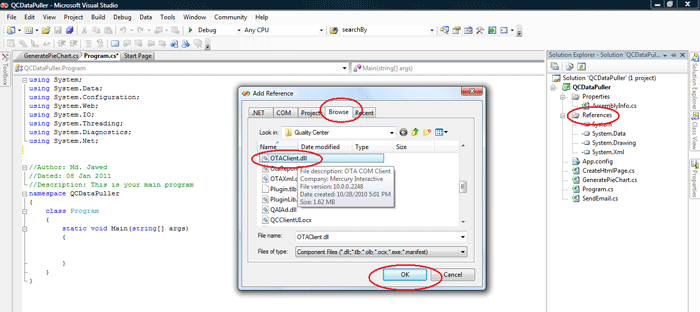
Fig 4. Adding OTAClient.dll
- Go to your main program; add the name space as shown in the figure below:
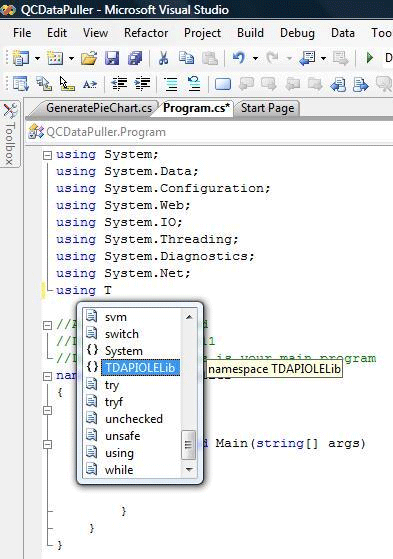
Fig 5. Adding the TDAPIOLELib name space.
Now you are ready to use the class and function provided by the OTA API.
We start our programming here afterwards.
We will read all the settings provided in the App.config file into our local strings so that we can use them in a program here and there.
//Read all the inputs value from App.config file and store in to variable for further use.
//variable to store UserName to login in to QC
string username = ConfigurationSettings.AppSettings["username"].ToString();
//Varible to store Password
string pwd = ConfigurationSettings.AppSettings["pwd"].ToString();
//Names of the test Cases smimilar to QC
string strTestCaseStatus = ConfigurationSettings.AppSettings["TCStatusNames"].ToString();
//Folder Name for test cases uploaded in to QC(Root\\Integration Team\\Anna-GR-3)
string testSetFolderPath = ConfigurationSettings.AppSettings["QCFolderLocationForTestCase"].ToString();
//Title of the Pie Chart
string chartTitleTestCasesReport = ConfigurationSettings.AppSettings["ChartTitleForTestCasesReport"].ToString();
//Location on to local derive where we want to store Pie chart
string strLocationToSavePieChartImages = ConfigurationSettings.AppSettings["locationToSavePieChartImages"].ToString();
//Server Location of QC
string strServerURL = ConfigurationSettings.AppSettings["QCserverURL"].ToString();
//Domain name for QC access
string strDomainName = ConfigurationSettings.AppSettings["QCdomainName"].ToString();
//Project name to access from QC
string strProjectName = ConfigurationSettings.AppSettings["QCprojectName"].ToString();
//Local derive location to store HTML web page for result
string strHtmlWebpageLocation = ConfigurationSettings.AppSettings["htmlWebPageLocation"].ToString();
Now we are ready with the all the input to strat our programming.
- First login to the QC.
//Decalare an object of TDCoonection
TDConnection qctd = new TDConnection();
//Pass the QC server URL
qctd.InitConnectionEx(strServerURL);
//Connect with the QC
qctd.ConnectProjectEx(strDomainName, strProjectName, username, pwd);
- Go to the Test lab folder from where you have to read the test cases.
- Collect all the test cases and there correspoding status in dataset.
- Using data view the count of various test status like passed, failed etc
Class Diagram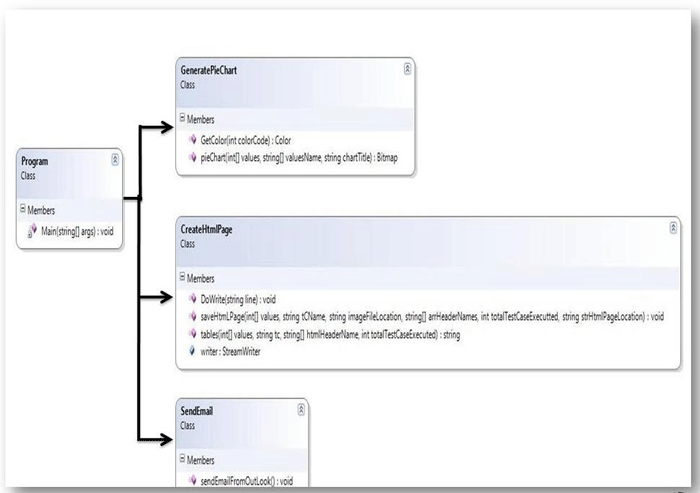
The code is as shown below.
if (qctd.Connected)
{
//Decaler test set factory
TestSetFactory testSetFactory = (TestSetFactory)qctd.TestSetFactory;
//Define filter
TDFilter filter = (TDFilter)testSetFactory.Filter;
//Go through each test set folder
string[] testCasesFolderNames = testSetFolderPath.Split(';');
//get the chart title name
string[] arrChartTitleTestCasesReport = chartTitleTestCasesReport.Split(';');
int chartTitleCount = 0;
foreach (string testFoldername in testCasesFolderNames)
{
if (testFoldername!=null)
{
filter["CY_FOLDER_ID"] = "\"" + testFoldername + "\"";
//get all the list of test cases
List testSets = (List)testSetFactory.NewList(filter.Text);
//make sure that the list of test cases is not null
if (testSets != null)
{
//Read all the tescases status from appconfig files.
string[] arrValueNames = strTestCaseStatus.Split(';');
//Define dataset to hold all the values for tescases execution
DataSet dsTC = new DataSet();
dsTC.Tables.Add("TestCaseExecutionReport");
dsTC.Tables[0].Columns.Add("TestName");
dsTC.Tables[0].Columns.Add("TestStatus");
//Read the Test cases status one by one from the folder location provided by the user.
foreach (TDAPIOLELib.TestSet tst in testSets)
{
string nameOfTestSuit = tst.Name;
TSTestFactory tstf = (TSTestFactory)tst.TSTestFactory;
List ftest = (List)tstf.NewList(" ");
//integer value to hold the total status count
int[] TCStatus = new int[arrValueNames.Length];
try
{
//trace trough each test cases to get the status
foreach (TDAPIOLELib.TSTest test in ftest)
{
//store that value in to dataset
dsTC.Tables[0].Rows.Add(test.Name, test.Status);
}
//Get the total row
int totalRow = dsTC.Tables[0].Rows.Count;
//Initialize the value to short the dataset to get the status count
int TSrowValue = 0;
//read the dataset to get the total status count
foreach (string TCfilterValue in arrValueNames)
{
if (TCfilterValue != null)
{
DataView dvDataTC = new DataView(dsTC.Tables[0]);
dvDataTC.RowFilter = "TestStatus like '" + TCfilterValue + "'";
TCStatus[TSrowValue] = dvDataTC.Count;
TSrowValue++;
}
// TCStatus[TCStatus.Length] = totalRow;
}
//local variable to use for Pie chart images name
string strImageNames = nameOfTestSuit + "_" + DateTime.Now.ToString("yyyyMMddHHmmss") + ".png";
//Gee the string for chart title
string chartTitle=string.Empty;
if(arrChartTitleTestCasesReport.Length==1)
{
chartTitle = arrChartTitleTestCasesReport[0] + " " + nameOfTestSuit;
}
else
{
chartTitle = arrChartTitleTestCasesReport[chartTitleCount] + " " + nameOfTestSuit; ;
}
//= chartTitleTestCasesReport + " " + nameOfTestSuit;
//Call a method to create pie chart
Bitmap btMapImages = GeneratePieChart.pieChart(TCStatus, arrValueNames, chartTitle);
//Save that pie chart a particualar location
btMapImages.Save(strLocationToSavePieChartImages + strImageNames, System.Drawing.Imaging.ImageFormat.Png);
//call a method to create html webpage and put all the report over there
CreateHtmlPage.saveHtmLPage(TCStatus, nameOfTestSuit, strLocationToSavePieChartImages + strImageNames, arrValueNames, totalRow, strHtmlWebpageLocation);
//Clear the data set so that all the store rows value will get deleted.
dsTC.Clear();
} //end of try block
catch (Exception ex)
{
Console.WriteLine(ex.Message);
} //end of catch block
}
} //end of checking List for test cases
}//end of checking for multiple folder
//increse the count
chartTitleCount += 1;
}//end of for each loop
}//end of checking Connection
}//end of try block
catch (Exception ex)
{
Console.WriteLine(ex.Message);
}//end of catch block
}
}
}
- Now we will call the pie chart function to draw a pie chart for the various test statuses. We will pass various parameters to the pie chart method to draw our pie chart like: test status count, test status names, chart title.
For the code to draw a pie chart, download the code and go through the code. You can use your own code for that purpose also. There is so much code available on the internet to draw a pie chart.
- The pie chart method will return the images as a bitmap. We will save the images to our local location to use this in a HTML web page report; alternatively you can directly use them in a HTML page but for record purposes I am saving this to our local location.
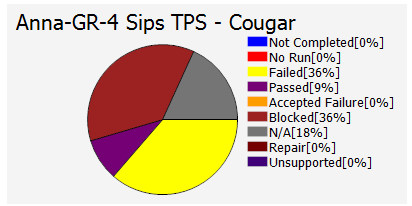
Fig 6. Pie chart sample
//Save that pie chart a particualar location
btMapImages.Save(strLocationToSavePieChartImages + strImageNames, System.Drawing.Imaging.ImageFormat.Png);
- After that we will call a method to put all the data into a HTML web page with tabular format as shown in the diagram below:
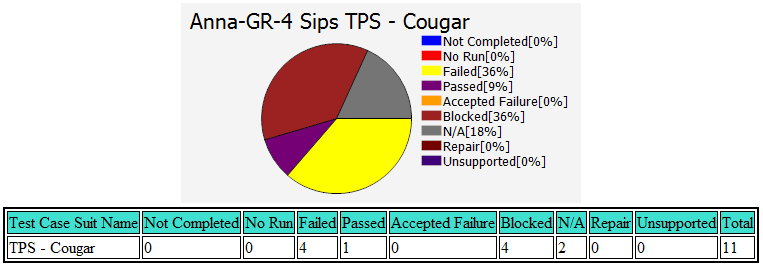
Fig 7. Format in to HTML web page
For the code please go through the code uploaded on this website. I have provided comments at each line so that you can understand better and in a nice way.
- Call your method to send out the report as attached or embedded in the email through outlook or any email client.
- The ready report would be available in to your mail box.
- You can add this *.exe to your windows scheduler to run daily of weekly basis and to send out report to your team members or whomever you want.
Is this not great!!!
So being an automation engineer this is our responsibility to make automate a manual process so that we can save time, effort and of course money.
Future Enhancement
- Error handing.
- Support for Bug Report
- Email sending Support
- Code Optimization/organization.
Happy Coding!