

Introduction
Azure log analytics gives you the facility to search and view logged data from various Azure resources. Before this was a separate service in Azure but now it's being incorporated as part of Azure monitor. In this demo we are going to learn how to manage Azure Log Analytics.
Step 1 - Log Analytics
Log into the Azure portal using your account credentials at the following URL. https://portal.azure.com/
On the dashboard, choose to create a resource and type "Log Analytics".
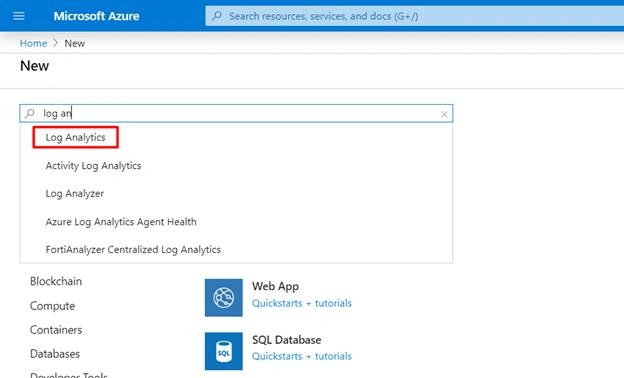
Step 2 - Creating Log Analytics
Click “Create” button to deploy the Log Analytics Service.
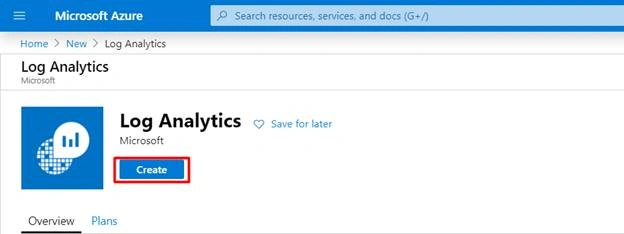
Step 3 - Log Analytics Workspace
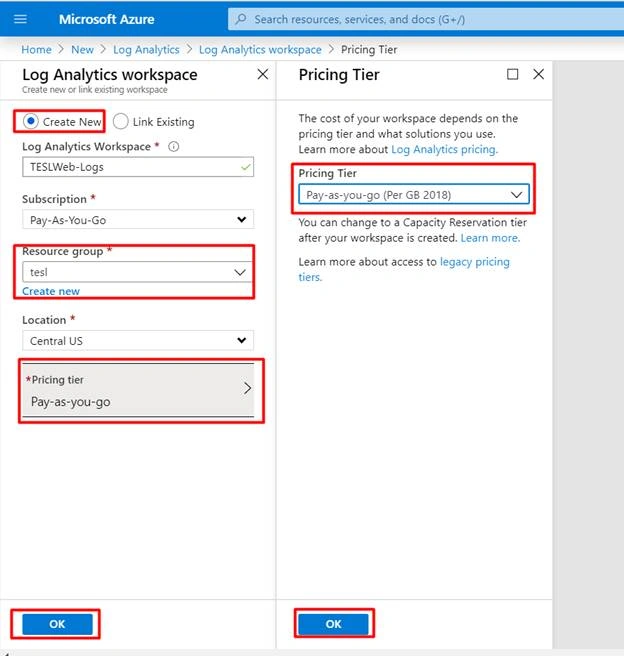
Select “Create New” in the Log Analytics. Enter the “Log Analytics Workspace” name, choose the correct “Subscription”. Select the existing resource group, and then select the “Pricing Tier”, after entering the information, click “Ok” button to start the deployment.
Step 4 - Verifying the Log Analytics Workspace
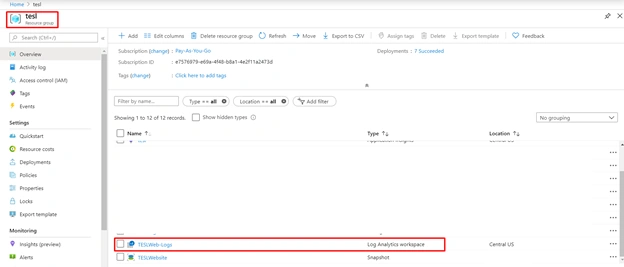
After successfully deploying the Log Analytics Workspace, we need to verify our Log Analytics Workspace. Go to your Resource Group and verify that our Log Analytics Workspaces are installed correctly. So here our Log Analytics Workspace named “TESLWeb-Logs” is successfully deployed, so click the “TESLWeb-Logs”.
Step 5 - Adding Virtual Machine
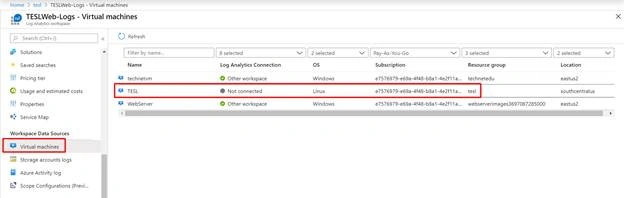
In the Log Analytics Workspace “TESLWeb-Logs” select “Virtual Machines” under the Workspace Data Sources, now we can verify that our Virtual Machine “TESL” is not connected so click the Virtual Machine.
Step 6 - Connecting our Virtual Machine
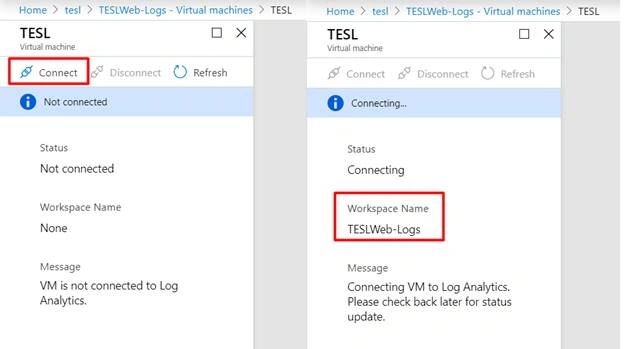
Now we can verify that our Virtual Machine Status is not connected and the Workspace Name is None, so Click “Connect”. After clicking “Connect” now we can verify that our Workspace name is “TESLWeb-Logs”.
Step 7 - Verifying the Connection
Now our Virtual Machine “TESL” is connected to the Log Analytics Connection.

Step 8 - Connecting the Sources
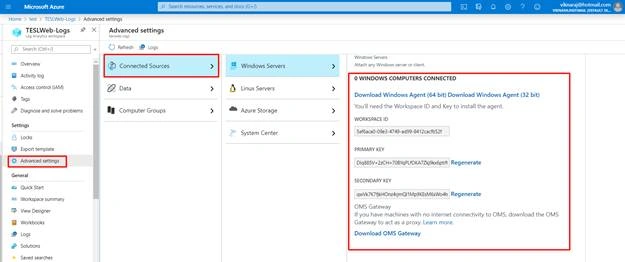
Select the Log Analytics workspace and then click “Advanced Settings”. Here we can find the Connected Sources. This option is for On-Premises Servers, you can download the OMS Gateway and analyze the logs.
Step 9 - Selecting the Performance counters
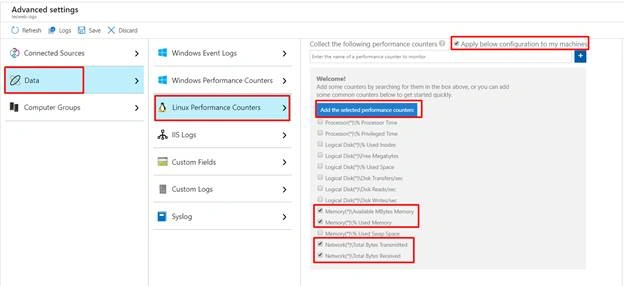
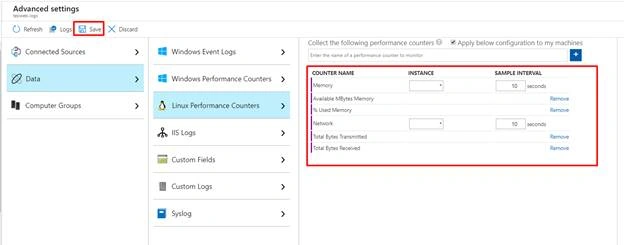
In this demo our workloads are running to the cloud, so click “Data”. Our Virtual Machine Operating System is Linux, so click “Linux Performance Counters”, then select “Apply below configuration to my machine”. After that select the performance counters, and then click “Add the selected performance counters”.
Step 10 - Performance Interval
Select the performance Interval, and then click “Save”.
Step 11 - Monitoring the Logs
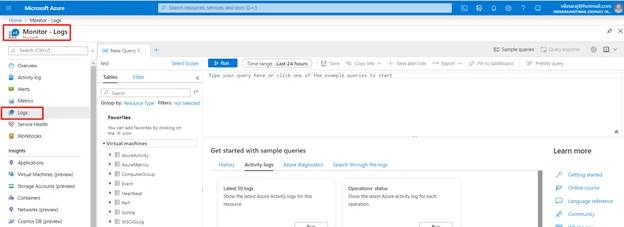
Search monitor in the search box, in the Monitor tool, click “Logs”
Step 12 - Running the Query
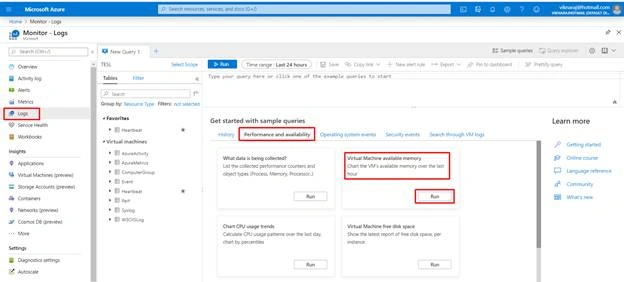
In the Logs, Select the “Performance and Availability” then select “Virtual Machine available memory” and then select “Run”.
Step 13 - Query Output
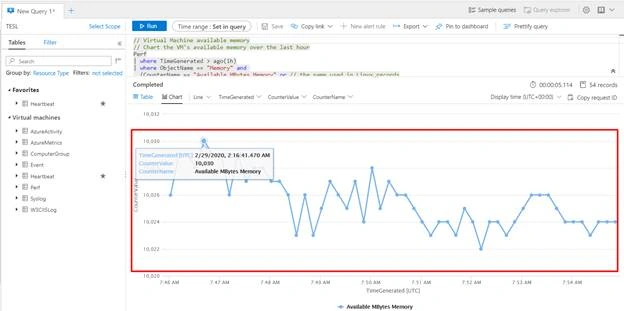
After running the query, we can get the chart of our Virtual Machines Memory usage output.
Summary
I hope you understood about Azure Log Analytics. In this demo we used a very simple query for analyzing, in our next article will learn more analyzing concepts using Azure Log Analytics.
Hadshana KamalanathanPosted Sep 28, 2021, 4:22 AM
Excellent Article.
Indunil AluviharePosted Aug 11, 2021, 7:58 AM
Nice article about Azure Log Analytics
Disne SivalingamPosted Mar 22, 2020, 3:05 AM
Good explanation