
Google Chart API
The Google Chart API lets you dynamically generate charts with a URL string and embed these charts on a web page, or download the image for local or offline use. The Google Chart Tools enable adding live charts to any web page. They provide advantages such as a rich gallery of visualizations provided as image charts and interactive charts and they can read live data from a variety of data sources. Users embed the data and formatting parameters in an HTTP request, and Google returns a PNG image of the chart. Many types of chart are supported, and by making the request into an image tag the chart can be included in a web page.
Install the following,
Step1 - Create a web app with .NET
- mkdir DemoGoogleChart
- cd DemoGoogleChart
- dotnet new mvc
Open the DemoGoogleChart folder in Visual Studio Code (VS Code) and select the Startup.cs file.
- Select Yes to the Warn message "Required assets to build and debug are missing from DemoGoogleChart . Add them?"
- Select Restore to the Info message "There are unresolved dependencies".

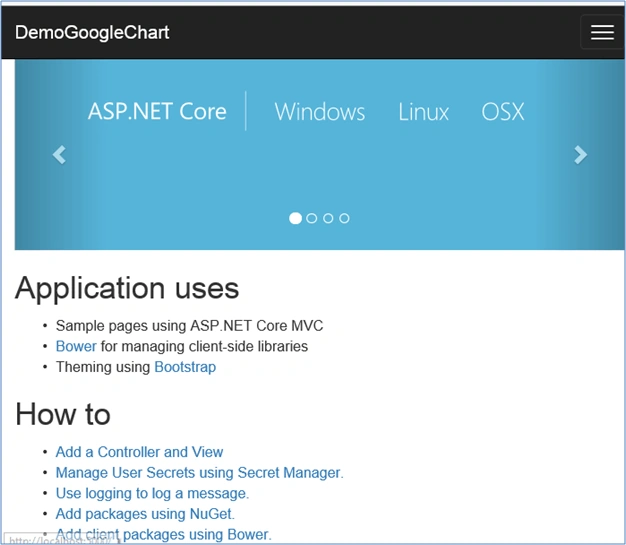
Press Debug (F5) to build and run the program.
VS Code starts the Kestrel web server and runs your app. Notice that the address bar shows localhost:5000 .
Step2
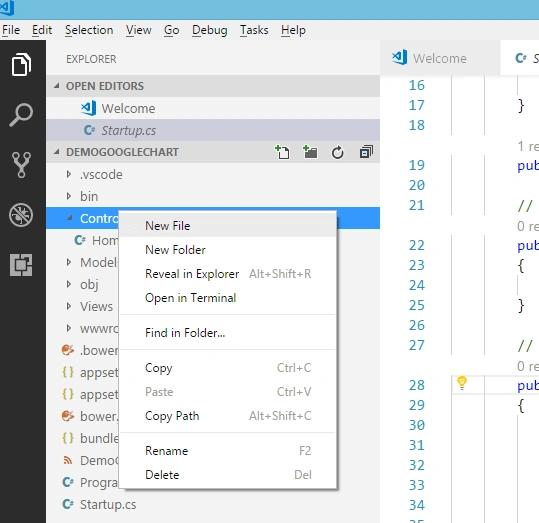
In VS Code, select the EXPLORER icon and then control-click (right-click) Controllers > New File and name the new file as PopulationController.cs.
Add the following code.
- public class PopulationController: Controller
- {
- public IActionResult Index() {
- return View();
- }
- //This method is to return JSO data the population for each states.
- public JsonResult PopulationChart() {
- var populationList = PopulationDataHelper.GetUsStatePopulationList();
- return Json(populationList);
- }
- }
Step4
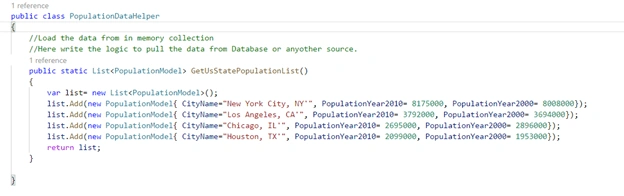
Return JSON Data from InMemory collection. Here, we can write the code to pull the data from different sources; i.e. DB or XML.
Step5
Select the EXPLORER icon and then control-click (right-click) Views > New File and name the new file as Index.cshtml. Here, copy the below code.
- <title>@ViewData["Title"] - DemoGoogleChart</title>
- <script type="text/javascript" src="https://www.gstatic.com/charts/loader.js"></script>
- <div id="chart_div"></div>
- <script type="text/javascript">
- google.charts.load('current', {
- packages: ['corechart', 'bar']
- });
- google.charts.setOnLoadCallback(LoadData);
- function LoadData() {
- $.ajax({
- url: '@Url.Action("PopulationChart","Population")',
- dataType: "json",
- type: "GET",
- error: function(xhr, status, error) {
- var err = eval("(" + xhr.responseText + ")");
- toastr.error(err.message);
- },
- success: function(data) {
- PopulationChart(data);
- return false;
- }
- });
- return false;
- }
- function PopulationChart(data) {
- var dataArray = [
- ['City', '2010 Population', '2000 Population']
- ];
- $.each(data, function(i, item) {
- dataArray.push([item.cityName, item.populationYear2010, item.populationYear2000]);
- });
- var data = google.visualization.arrayToDataTable(dataArray);
- var options = {
- title: 'Population of Largest U.S. Cities',
- chartArea: {
- width: '50%'
- },
- colors: ['#b0120a', '#ffab91'],
- hAxis: {
- title: 'Total Population',
- minValue: 0
- },
- vAxis: {
- title: 'City'
- }
- };
- var chart = new google.visualization.BarChart(document.getElementById('chart_div'));
- chart.draw(data, options);
- return false;
- }
- </script>
Step 6
Edit the Views/Shared/_Layout page to add new menu; i.e. US Population Chart.

- <div class="navbar-collapse collapse">
- <ul class="nav navbar-nav">
- <li><a asp-area="" asp-controller="Home" asp-action="Index">Home</a></li>
- <li><a asp-area="" asp-controller="Home" asp-action="About">About</a></li>
- <li><a asp-area="" asp-controller="Home" asp-action="Contact">Contact</a></li>
- <li><a asp-area="" asp-controller="Population" asp-action="Index">US Population Chart </a></li>
- </ul>
- </div>
Step 7
Now, run the application and click on the Players list from the start page.
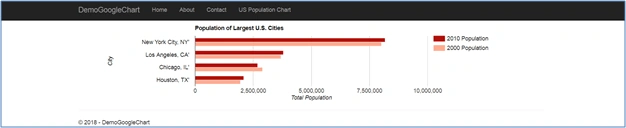
That's it. Thanks for reading.
apple powerPosted May 22, 2019, 6:07 AM
Is there a way if i can get a similar example in Razor Pages?
Walid ElghribPosted Jun 18, 2018, 5:54 AM
Hi Srikant ! i want to edit the data items . How can i do that ?
Oracular ManPosted Mar 23, 2018, 4:50 PM
for more than 6 cities and not expanding verticallyvar options = { title: 'Most Done on a Daily basis. Live more today.', chartArea: { width: '50%', height: '100%' }, colors: ['#295BA4'], hAxis: { title: 'Total Count', minValue: 0 }, vAxis: { title: 'Definitions', minValue: 0 } };
Oracular ManPosted Mar 6, 2018, 8:32 PM
Excellent Srikant. Thanks. It worked in VS 2017 with .NET Core 2.0 EF Core MVC on MAC.
Allan TeetlausPosted Jan 29, 2018, 7:27 AM
Hi Srikant, I tried it in two ways. Firstly, put the PopulationDataHelper class code into the PopulationController and secondly, into the separate class PopulationDataHelper.cs. It is getting even worse. Can you describe, where to exactly put this code.
Allan TeetlausPosted Jan 28, 2018, 8:05 AM
Hi, I did it in VS 2017 Community. Got an error: CS0103 The name 'PopulationDataHelper' does not exist in the current context.
Sagar Pandurang KapPosted Jan 14, 2018, 11:51 PM
Great thing.Very useful.Keep Sharing..