

Introduction
There are a lot of chart libraries available for Angular 7. We are going to use Highchart and will bind the data from Web API to make dynamic data binding.
Prerequisite
- Basic knowledge of Angular 7
- Visual Studio Code
- Angular CLI must be installed
- NodeJS must be installed
Let’s get started.
Open Visual Studio Code and open a new terminal.
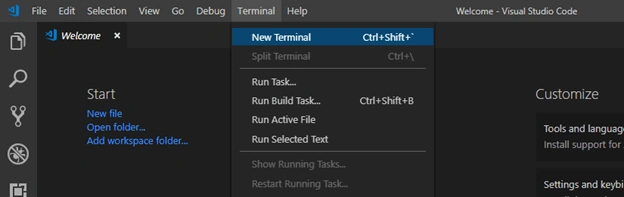
Type the following command in it.
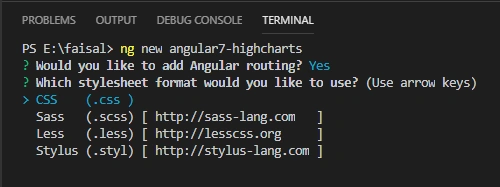
- ng new angular7-highcharts
In the questions asked on the screen, answer "Yes" for Angular routing and use CSS for the stylesheet.
We will also need to install the Highchart as we are going to use this library.

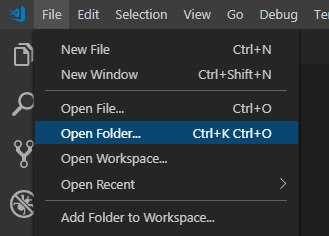
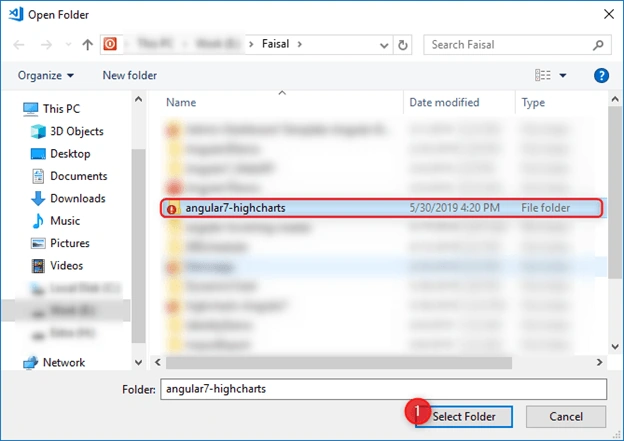
Open the project in Visual Studio Code by opening the folder.
Choose your project folder and open it.
Now, let’s create the component for the project. So, open the terminal and type the following command.
- ng g c highchart-demo

Now, we are done with the installation and project setup. So, let us add logic for Highchart.
Open the app.component.html file and add the highlighted line in it.
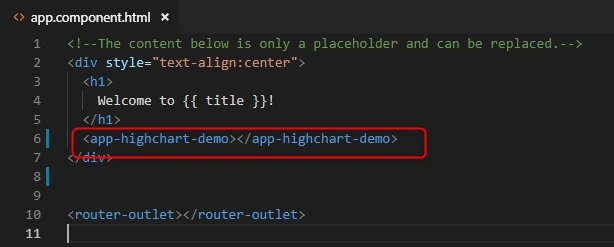
- <app-highchart-demo></app-highchart-demo>
Open the highchart-demo.component.ts file and replace the code with the below code in it.
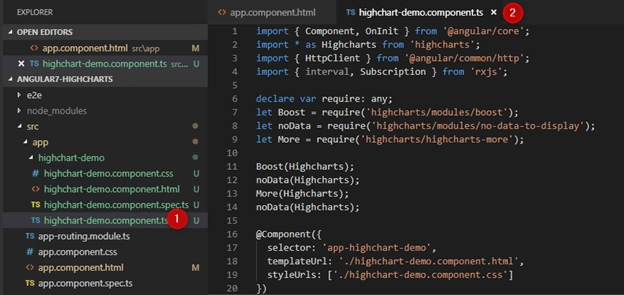
- import { Component, OnInit } from '@angular/core';
- import * as Highcharts from 'highcharts';
- import { HttpClient } from '@angular/common/http';
- import { interval, Subscription } from 'rxjs';
- declare var require: any;
- let Boost = require('highcharts/modules/boost');
- let noData = require('highcharts/modules/no-data-to-display');
- let More = require('highcharts/highcharts-more');
- Boost(Highcharts);
- noData(Highcharts);
- More(Highcharts);
- noData(Highcharts);
- @Component({
- selector: 'app-highchart-demo',
- templateUrl: './highchart-demo.component.html',
- styleUrls: ['./highchart-demo.component.css']
- })
- export class HighchartDemoComponent implements OnInit {
- public options: any = {
- chart: {
- type: 'line',
- height: 500
- },
- title: {
- text: 'Sample Scatter Plot'
- },
- credits: {
- enabled: false
- },
- tooltip: {
- formatter: function() {
- return 'x: ' + this.x + ' y: ' + this.y;
- }
- },
- xAxis: {
- categories: []
- },
- series: [
- {
- name: 'Mr. Faisal',
- data: []
- },
- {
- name: 'Mr. Pathan',
- data: []
- }
- ]
- }
- subscription: Subscription;
- constructor(private http: HttpClient) { }
- ngOnInit(){
- // update data again and again after every 5 seconds interval
- //const source = interval(5000);
- // My dummy API
- const apiLink = 'https://api.myjson.com/bins/zg8of';
- this.getApiResponse(apiLink).then(
- //this.subscription = source.subscribe(val =>this.getApiResponse(apiLink).then(
- data => {
- const faisalArr = [];
- const pathanArr = [];
- const xAxisArr = [];
- data.forEach(row => {
- const temp_row = [
- row.Sales_Figure
- ];
- if(xAxisArr.find(ob => ob === row.Month) === undefined){
- xAxisArr.push(row.Month)
- }
- row.Name === 'Faisal' ? faisalArr.push(temp_row) : pathanArr.push(temp_row);
- });
- this.options.xAxis['categories'] = xAxisArr;
- this.options.series[0]['data'] = faisalArr;
- this.options.series[1]['data'] = pathanArr;
- Highcharts.chart('container', this.options);
- },
- error => {
- console.log('Something went wrong.');
- })
- //)
- ;
- }
- async getApiResponse(url: string) {
- const res = await this.http.get<any[]>(url, {})
- .toPromise();
- return res;
- }
- }
Open the app.module.ts file present at the root folder and add the HttpClientModule references there.
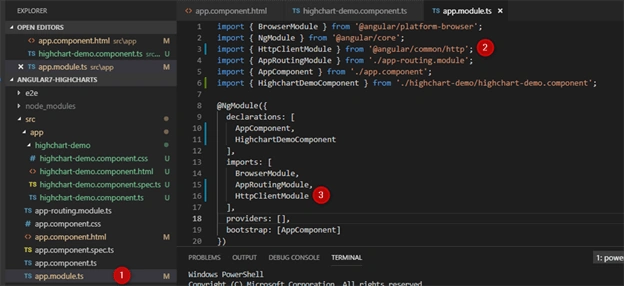
- import { HttpClientModule } from '@angular/common/http';
Open the highchart-demo.component.html file add the below HTML tag in it to display our chart.
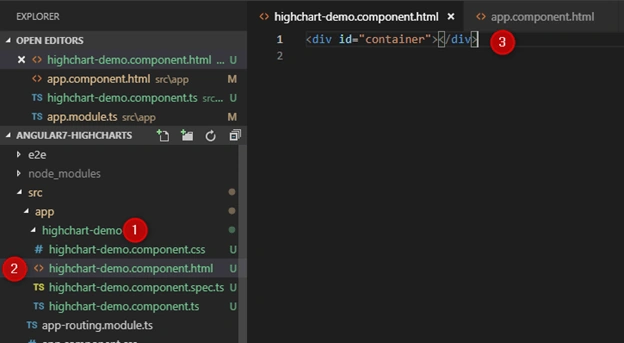
- <div id="container"></div>
That’s it. Now, fire the below command to see the magic!
- ng serve
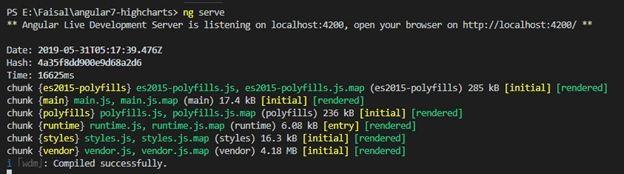
Open your browser on http://localhost:4200/ or click on “http://localhost:4200/” it.
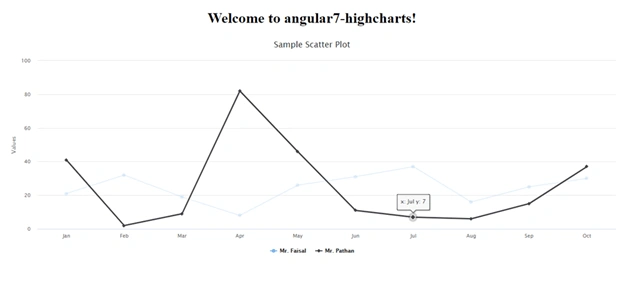
Output
Please give your valuable feedback/comments/questions about this article below. Please let me know if you liked this article and comment below to tell how I could improve it.
You can download the source code from here.
Sarathlal SaseendranPosted Jun 3, 2019, 10:58 AM
Good one Faisal