

Introduction
In this pandemic period, many of us are suffering due to Corona virus. I have decided to create a simple app to track the important details of Covid-19 and show this data in the dashboard. This app will provide an option to choose a country and display the data of that particular country easily. We will also display the highest recovered top 10 country details along with highest confirmed and highest death details.
API used for getting Covid-19 data

We are using https://covid19api.com/ to fetch the latest data for Covid-19 affected people. There are various API methods available in this application but for our purpose, we are using only one API method, https://api.covid19api.com/summary This method will provide all the global summary data along with summary of each active countries. These data are currently sufficient for our application. I am not claiming any data accuracy. This is only for learning purpose.
Create Angular 10 application using latest Angular CLI
We can use below CLI command to create new Angular 10 app.
ng new covid19-tracker
After loading all the node packages and dependencies, we can add Angular Material to the project.
ng add @angular/material
We can choose the default theme for material design and choose other default options.
Open the source code in Visual Studio Code.
We must import references for HttpClientModule, MatCardModule, and MatSelectModule modules in app.module.
app.module.ts
- import { BrowserModule } from '@angular/platform-browser';
- import { NgModule } from '@angular/core';
- import { AppComponent } from './app.component';
- import { BrowserAnimationsModule } from '@angular/platform-browser/animations';
- import { HttpClientModule } from '@angular/common/http';
- import { MatCardModule } from '@angular/material/card';
- import { MatSelectModule } from '@angular/material/select';
- @NgModule({
- declarations: [
- AppComponent
- ],
- imports: [
- BrowserModule,
- BrowserAnimationsModule,
- HttpClientModule,
- MatCardModule,
- MatSelectModule
- ],
- providers: [],
- bootstrap: [AppComponent]
- })
- export class AppModule { }
Create a data service to fetch data from Covid-19 API application.
data.service.ts
- import { Injectable } from '@angular/core';
- import { HttpClient } from '@angular/common/http';
- import { Observable } from 'rxjs';
- @Injectable({
- providedIn: 'root'
- })
- export class DataService {
- constructor(private http: HttpClient) { }
- private url: string = "https://api.covid19api.com/summary";
- getData(): Observable<any> {
- return this.http.get(this.url)
- .pipe((response) => response);
- }
- }
In above service, we are fetching the summary method from Covid-19 API application.
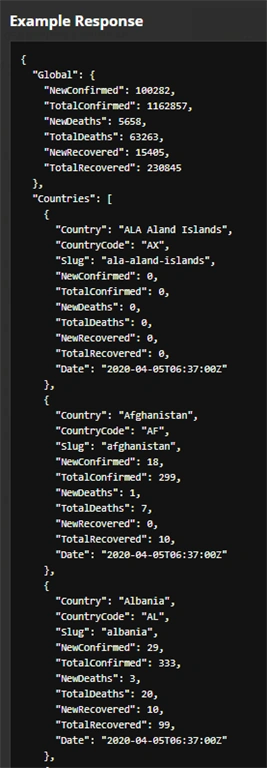
Above is the sample response from that API method. This response has two parts. Global summary part and country wise summary part. This is the entire country data as an array.
We can create some model classes inside the model.ts file.
model.ts
- export class SummaryData {
- Global: GlobalData;
- Countries: Array<CountryData>;
- Date: Date;
- }
- export class GlobalData {
- NewConfirmed: number;
- NewDeaths: number;
- NewRecovered: number;
- TotalConfirmed: number;
- TotalDeaths: number;
- TotalRecovered: number
- }
- export class CountryData extends GlobalData {
- Country: string;
- CountryCode: string;
- Date: Date;
- Slug: string
- }
We have created three model classes SummaryData, GlobalData, and CountryData.
We can modify the app.component.ts file with below code.
app.component.ts
- import { Component, OnInit } from '@angular/core';
- import { SummaryData, CountryData } from './models';
- import { DataService } from './data.service';
- import { DatePipe } from '@angular/common';
- @Component({
- selector: 'app-root',
- templateUrl: './app.component.html',
- styleUrls: ['./app.component.css'],
- providers: [DatePipe]
- })
- export class AppComponent implements OnInit {
- title = 'covid19-tracker';
- summaryData: SummaryData;
- indiaData: CountryData;
- selectedCountryData: CountryData;
- highlyConfirmedData: Array<CountryData>;
- highlyDeathData: Array<CountryData>;
- highlyRecoveredData: Array<CountryData>;
- currentDate: string;
- constructor(private service: DataService, private datePipe: DatePipe) { }
- ngOnInit() {
- let date = new Date();
- this.currentDate = this.datePipe.transform(date,'dd-MMM-yyyy');
- this.getAllData();
- }
- getAllData() {
- this.service.getData().subscribe(
- response => {
- this.summaryData = response;
- this.getIndiaData();
- this.getSortedData();
- }
- )
- }
- getIndiaData() {
- this.indiaData = this.summaryData.Countries.find(x => x.Slug == "india");
- }
- getSortedData() {
- let data = JSON.parse(JSON.stringify(this.summaryData.Countries));
- this.highlyConfirmedData = data.sort((a, b) => b.TotalConfirmed - a.TotalConfirmed).slice(0, 10);
- this.highlyDeathData = data.sort((a, b) => b.TotalDeaths - a.TotalDeaths).slice(0, 10);
- this.highlyRecoveredData = data.sort((a, b) => b.TotalRecovered - a.TotalRecovered).slice(0, 10);
- }
- }
We have fetched the global summary data from data service and populated other data for our application. I have used very simple logic for this.
We can modify the app.component.html file with below code snippets.
app.component.html
- <div style="width: 1200px;">
- <div class="same-row" style="width: 550px;">
- <img src="../assets/CovidTracker.PNG">
- </div>
- <div class="same-row" style="font-weight: bold;">
- As on : {{currentDate}}
- </div>
- <div class="same-row">
- <mat-form-field appearance="fill" style="width: 300px;">
- <mat-label>Choose a Country</mat-label>
- <mat-select [(value)]="selectedCountryData">
- <mat-option *ngFor="let country of summaryData?.Countries" [value]="country">{{country.Country}}
- </mat-option>
- </mat-select>
- </mat-form-field>
- </div>
- </div>
- <div>
- <div class="same-row">
- <mat-card class="covid-card">
- <mat-card-header>
- <div mat-card-avatar>
- <img
- src="https://www.sanlam.co.uk/web/media/media/vectors%2018/globe_light_blue_rgb.png?width=32&height=32&mode=crop">
- </div>
- <mat-card-title>Global Summary</mat-card-title>
- <mat-card-subtitle>Total Countries</mat-card-subtitle>
- </mat-card-header>
- <mat-card-content>
- <table>
- <tr>
- <td>
- New Recovered
- </td>
- <td>
- {{summaryData?.Global?.NewRecovered | number}}
- </td>
- </tr>
- <tr>
- <td>
- Total Recovered
- </td>
- <td>
- {{summaryData?.Global?.TotalRecovered | number}}
- </td>
- </tr>
- <tr>
- <td>
- New Confirmed
- </td>
- <td>
- {{summaryData?.Global?.NewConfirmed | number}}
- </td>
- </tr>
- <tr>
- <td>
- Total Confirmed
- </td>
- <td>
- {{summaryData?.Global?.TotalConfirmed | number}}
- </td>
- </tr>
- <tr>
- <td>
- New Deaths
- </td>
- <td>
- {{summaryData?.Global?.NewDeaths | number}}
- </td>
- </tr>
- <tr>
- <td>
- Total Deaths
- </td>
- <td>
- {{summaryData?.Global?.TotalDeaths | number}}
- </td>
- </tr>
- </table>
- </mat-card-content>
- </mat-card>
- </div>
- <div class="same-row">
- <mat-card class="covid-card">
- <mat-card-header>
- <div mat-card-avatar>
- <img src="https://www.countryflags.io/IN/shiny/32.png">
- </div>
- <mat-card-title>Country Summary</mat-card-title>
- <mat-card-subtitle>India</mat-card-subtitle>
- </mat-card-header>
- <mat-card-content>
- <table>
- <tr>
- <td>
- New Recovered
- </td>
- <td>
- {{indiaData?.NewRecovered | number}}
- </td>
- </tr>
- <tr>
- <td>
- Total Recovered
- </td>
- <td>
- {{indiaData?.TotalRecovered | number}}
- </td>
- </tr>
- <tr>
- <td>
- New Confirmed
- </td>
- <td>
- {{indiaData?.NewConfirmed | number}}
- </td>
- </tr>
- <tr>
- <td>
- Total Confirmed
- </td>
- <td>
- {{indiaData?.TotalConfirmed | number}}
- </td>
- </tr>
- <tr>
- <td>
- New Deaths
- </td>
- <td>
- {{indiaData?.NewDeaths | number}}
- </td>
- </tr>
- <tr>
- <td>
- Total Deaths
- </td>
- <td>
- {{indiaData?.TotalDeaths | number}}
- </td>
- </tr>
- </table>
- </mat-card-content>
- </mat-card>
- </div>
- <div class="same-row" *ngIf="selectedCountryData!=undefined">
- <mat-card class="covid-card">
- <mat-card-header>
- <div mat-card-avatar>
- <img src="https://www.countryflags.io/{{selectedCountryData.CountryCode}}/shiny/32.png">
- </div>
- <mat-card-title>Country Summary</mat-card-title>
- <mat-card-subtitle>{{selectedCountryData.Country}}</mat-card-subtitle>
- </mat-card-header>
- <mat-card-content>
- <table>
- <tr>
- <td>
- New Recovered
- </td>
- <td>
- {{selectedCountryData?.NewRecovered | number}}
- </td>
- </tr>
- <tr>
- <td>
- Total Recovered
- </td>
- <td>
- {{selectedCountryData?.TotalRecovered | number}}
- </td>
- </tr>
- <tr>
- <td>
- New Confirmed
- </td>
- <td>
- {{selectedCountryData?.NewConfirmed | number}}
- </td>
- </tr>
- <tr>
- <td>
- Total Confirmed
- </td>
- <td>
- {{selectedCountryData?.TotalConfirmed | number}}
- </td>
- </tr>
- <tr>
- <td>
- New Deaths
- </td>
- <td>
- {{selectedCountryData?.NewDeaths | number}}
- </td>
- </tr>
- <tr>
- <td>
- Total Deaths
- </td>
- <td>
- {{selectedCountryData?.TotalDeaths | number}}
- </td>
- </tr>
- </table>
- </mat-card-content>
- </mat-card>
- </div>
- </div>
- <div>
- <div class="same-row table-data">
- <p style="font-weight: bold; color: darkgreen; font-size: large;">Highest Recovered Cases</p>
- <table>
- <tr>
- <td style="font-weight: bold;">
- Sl.No.
- </td>
- <td style="font-weight: bold;">
- Country
- </td>
- <td style="font-weight: bold;">
- Total Recovered
- </td>
- </tr>
- <tr *ngFor="let country of highlyRecoveredData; let i=index">
- <td>
- {{i+1}}
- </td>
- <td>
- {{country.Country}}
- </td>
- <td>
- {{country.TotalRecovered | number}}
- </td>
- </tr>
- </table>
- </div>
- <div class="same-row table-data">
- <p style="font-weight: bold; color:gray; font-size: large;">Highest Confirmed Cases</p>
- <table>
- <tr>
- <td style="font-weight: bold;">
- Sl.No.
- </td>
- <td style="font-weight: bold;">
- Country
- </td>
- <td style="font-weight: bold;">
- Total Confirmed
- </td>
- </tr>
- <tr *ngFor="let country of highlyConfirmedData; let i=index">
- <td>
- {{i+1}}
- </td>
- <td>
- {{country.Country}}
- </td>
- <td>
- {{country.TotalConfirmed | number}}
- </td>
- </tr>
- </table>
- </div>
- <div class="same-row table-data">
- <p style="font-weight: bold; color: indianred; font-size: large;">Highest Death Cases</p>
- <table>
- <tr>
- <td style="font-weight: bold;">
- Sl.No.
- </td>
- <td style="font-weight: bold;">
- Country
- </td>
- <td style="font-weight: bold;">
- Total Deaths
- </td>
- </tr>
- <tr *ngFor="let country of highlyDeathData; let i=index">
- <td>
- {{i+1}}
- </td>
- <td>
- {{country.Country}}
- </td>
- <td>
- {{country.TotalDeaths | number}}
- </td>
- </tr>
- </table>
- </div>
- </div>
We have used Angular material select component to list the country name and also used material card to display Covid-19 data. We have used some inline styles inside the html file but that is not advisable. I will cleanup this code very soon and remove these inline styles from html file.
We can add some css class details inside the app.component.css file.
app.component.css
- .covid-card {
- max-width: 350px;
- }
- .same-row {
- display: inline-block;
- padding: 10px;
- }
- .table-data {
- padding: 10px;
- margin: 10px;
- }
- table {
- padding: 10px;
- width: 300px;
- border: 1px solid gray;
- background-color: honeydew;
- }
- tr {
- margin: 10px;
- padding: 10px;
- }
- td {
- height: 30px;
- vertical-align: center;
- border: 1px dotted gray;
- }
We have successfully built our Covid-19 tracker application in short time. We can run the application now.
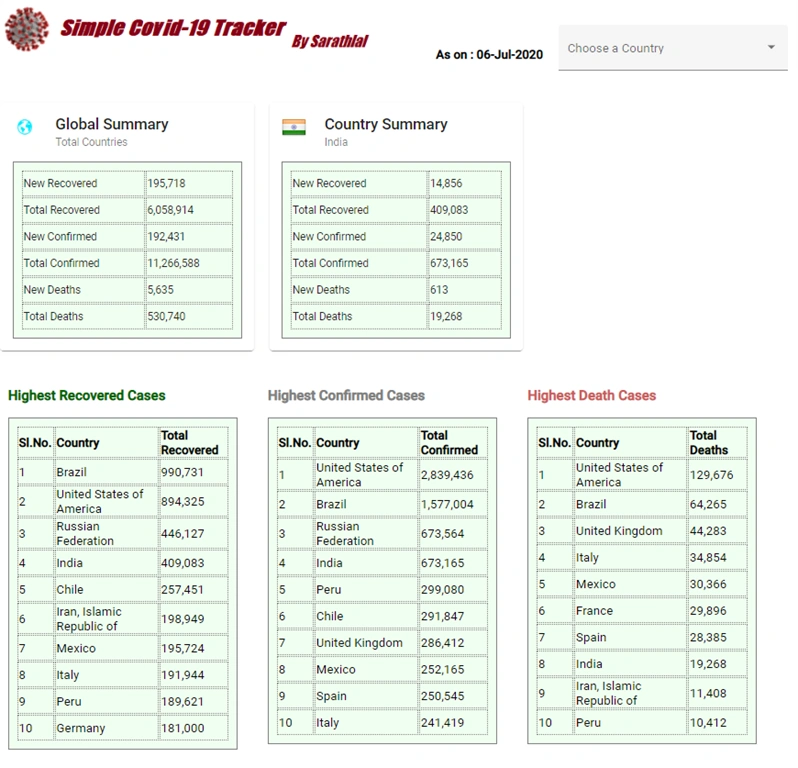
We have showed Global summary, Indian country summary along with top 10 highest recovered, highest confirmed and highest death cases.
User can choose the country name from the material list box.
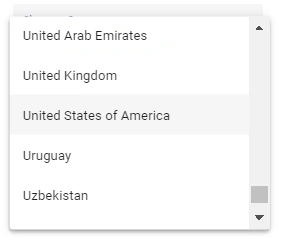
After choosing a country name, we can get the data for that particular country in below card.
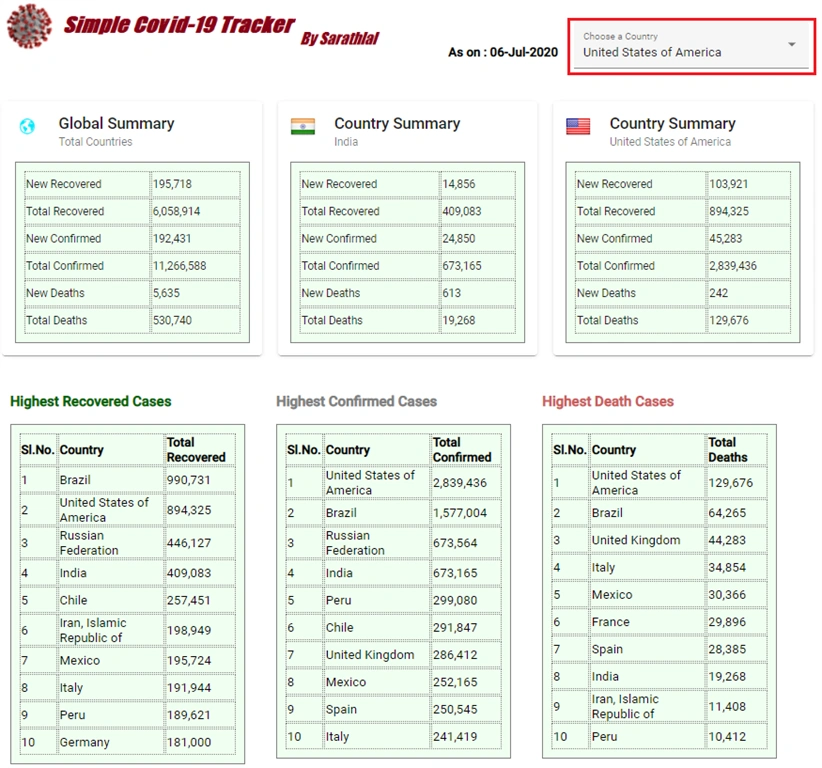
I have deployed this application to Google firebase and you can use this LIVE app to track Covid-19 data.
Conclusion
In this post, we have seen how to create a simple Covid-19 tracker app with Angular 10 using Material design. We have used https://covid19api.com/ free API service to fetch live data. We have provided an option to choose any country name and get data of that country. We have also provided the highest 10 recovered, highest confirmed, and highest death cases. If anybody is interested, we can tweak this application with more features like data analysis using some charts as well. Please feel free to provide the feedback about this application.
Sridhar YelagandhulaPosted Aug 4, 2020, 10:42 AM
Nice...But That API Data Ur created or Already is there?
Hamid KhanPosted Jul 17, 2020, 8:10 AM
Good article............. thank for it..............
rd sboaPosted Jul 6, 2020, 4:13 AM
Your api data output is not proper as on live records. second one is you deployed in firebase but you didn't mention the steps how you gave deployed this covid19 angular app in Google firebase.