

Introduction
Parts Of Lists
HardWareParts
- Arduino Uno
- BMP085
- Hook up wires
- Bread Board.
Software Required
- Arduino IDE
- Python 2.7.11
Connection
Connection From ArduinoUno To BMPO85 Sensor
| Sensor | Board |
| Gnd | Gnd |
| Vin | 5v |
| SDA | A3 |
| SCL | A4 |
Progarmming
- #include "Wire.h" // imports the wire library for talking over I2C
- #include "Adafruit_BMP085.h" // import the Pressure Sensor Library
- Adafruit_BMP085 mySensor; // create sensor object called mySensor
- float tempC; // Variable for holding temp in C
- float tempF; // Variable for holding temp in F
- float pressure; //Variable for holding pressure reading
- void setup(){
- Serial.begin(9600); //turn on serial monitor
- mySensor.begin(); //initialize mySensor
- }
- void loop() {
- tempC = mySensor.readTemperature(); // Read Temperature
- tempF = tempC*1.8 + 32.; // Convert degrees C to F
- pressure=mySensor.readPressure(); //Read Pressure
- Serial.print("The Temp is: "); //Print Your results
- Serial.print(tempF);
- Serial.println(" degrees F");
- Serial.print("The Pressure is: ");
- Serial.print(pressure);
- Serial.println(" Pa.");
- Serial.println("");
- delay(250); //Pause between readings.
- }
Program Of Python
- import serial # import Serial Library
- import numpy # Import numpy
- import matplotlib.pyplot as plt #import matplotlib library
- from drawnow import *
- tempF= []
- pressure=[]
- arduinoData = serial.Serial('com11', 115200) #Creating our serial object named arduinoData
- plt.ion() #Tell matplotlib you want interactive mode to plot live data
- cnt=0
- def makeFig(): #Create a function that makes our desired plot
- plt.ylim(80,90) #Set y min and max values
- plt.title('My Live Streaming Sensor Data') #Plot the title
- plt.grid(True) #Turn the grid on
- plt.ylabel('Temp F') #Set ylabels
- plt.plot(tempF, 'ro-', label='Degrees F') #plot the temperature
- plt.legend(loc='upper left') #plot the legend
- plt2=plt.twinx() #Create a second y axis
- plt.ylim(93450,93525) #Set limits of second y axis- adjust to readings you are getting
- plt2.plot(pressure, 'b^-', label='Pressure (Pa)') #plot pressure data
- plt2.set_ylabel('Pressrue (Pa)') #label second y axis
- plt2.ticklabel_format(useOffset=False) #Force matplotlib to NOT autoscale y axis
- plt2.legend(loc='upper right') #plot the legend
- while True: # While loop that loops forever
- while (arduinoData.inWaiting()==0): #Wait here until there is data
- pass #do nothing
- arduinoString = arduinoData.readline() #read the line of text from the serial port
- dataArray = arduinoString.split(',') #Split it into an array called dataArray
- temp = float( dataArray[0]) #Convert first element to floating number and put in temp
- P = float( dataArray[1]) #Convert second element to floating number and put in P
- tempF.append(temp) #Build our tempF array by appending temp readings
- pressure.append(P) #Building our pressure array by appending P readings
- drawnow(makeFig) #Call drawnow to update our live graph
- plt.pause(.000001) #Pause Briefly. Important to keep drawnow from crashing
- cnt=cnt+1
- if(cnt>50): #If you have 50 or more points, delete the first one from the array
- tempF.pop(0) #This allows us to just see the last 50 data points
- pressure.pop(0)
Explanation
In this article I will explain about how the BMP085 can be used to see the temperature level. In Arduino it will be displayed in the serial monitor but in Python I have used the matlab plot.
The matplot software is used to display the higher and lower levels of the temperature. Click the software below and download the software.
http:/pip.pypa.io/en/learning/installing.
In Python write the code and click the run module or f5 to see the output.
In Python the data and the code will be read from Arduino because we have given the Arduino port in Python.The matlab plot can plot the temperature in the current level.
Output
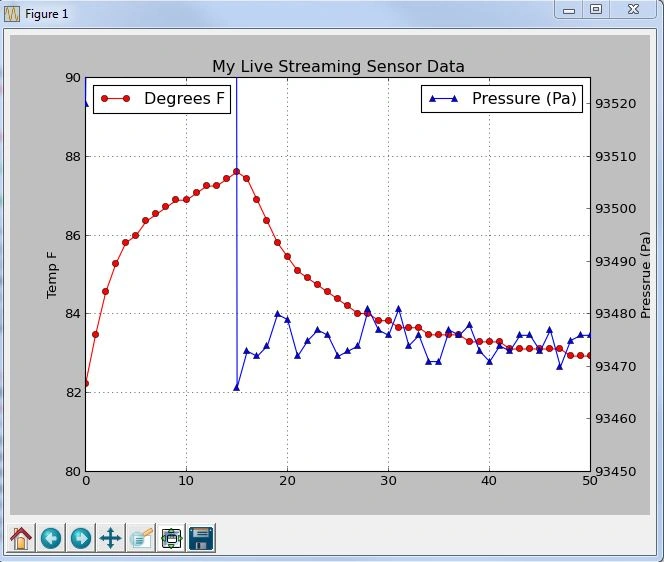
Figure 1 : Output
Hussain PatelPosted Nov 2, 2016, 10:40 AM
This is nice - I have done this using Raspberry Pi - hope to come up with article soon..
Vignesh ManiPosted Jul 11, 2016, 5:38 PM
Good one
Kumaresh RajalingamPosted Jul 9, 2016, 10:20 AM
Nice share
kalu singh raoPosted Jul 9, 2016, 10:12 AM
Nice...