

The Herfindahl-Hirschman Index (HHI) is a widely used measure of market concentration. The HHI is calculated by squaring the market share of each firm in the industry and summing the result:
HHI = s1^2 + s2^2 + s3^2 + ... + sn^2 where s is the market share of each firm.
The HHI is used as a measure of competition, with 10,000 meaning perfect monopoly (100^2) and 0.0 meaning perfect competition.
Let's take an example of Auto Ancillaries sector of listed Indian companies. In this example, I have taken Net sales figures that are in Rs. million in a quarter of Sep 2017.
| Company Name | Net Sales | % of Sales |
| AMARA RAJA BATT. | 14,275 | 11% |
| ASAHI INDIA | 6,247 | 5% |
| AUTO CORP. OF GOA | 1,421 | 1% |
| AUTOMOTIVE AXLES | 3,496 | 3% |
| BHARAT FORGE | 12,580 | 10% |
| BOSCH LTD | 28,119 | 22% |
| CARBORUNDUM UNIVERSAL | 5,871 | 5% |
| EXIDE INDUSTRIES | 23,713 | 19% |
| MUNJAL SHOWA | 4,153 | 3% |
| NRB BEARINGS | 2,082 | 2% |
| SCHAEFFLER INDIA LTD | 4,922 | 4% |
| SKF INDIA | 6,798 | 5% |
| SONA KOYO STEER | 3,028 | 2% |
| TIMKEN INDIA | 3,102 | 2% |
| WABCO INDIA | 6,098 | 5% |
| ZF STEERING | 1,099 | 1% |
The % share is calculated and data saved in txt format. The data files are shared with you along with the code.
In R let’s import the package HHI and import this data.
- install.packages('hhi')
- library(hhi)
- autoanc <- read.table('E:\\Veena\\HHI Example.txt', sep = "\t", header = T)
- # The HHI is used as a measure of competition, with 10,000 meaning
- # perfect monopoly (100^2) and 0.0 meaning perfect competition.
- hhi(autoanc,"Sep.2017")
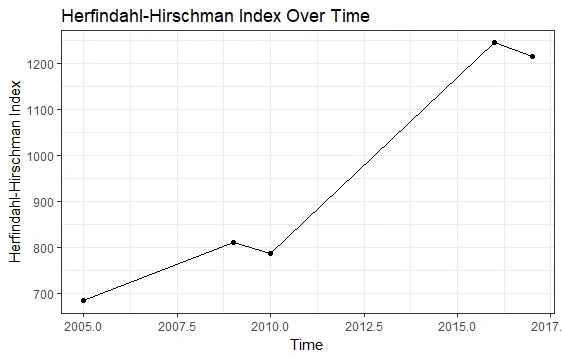
Now, let’s measure this result over several years and see the competitive behavior of this sector of the Indian industry.
Hadshana KamalanathanPosted Jul 22, 2018, 3:53 AM
Thanks for sharing..
Naresh SinghalPosted Apr 19, 2018, 11:15 PM
Nice to read this article ! thanks Madam !