

Introduction
ZedGraph is a class library, user control and web control for .Net written in C# for drawing 2D Line, Bar and Pie Charts. It features full, detailed customization capabilities, but most options have defaults for ease of use. It's very easy to create the various types of Zed Graph charts in ASP.NET.
You can download the ZED Graph library by downloading the sample code or Click here.
After downloading the reference add it to Visual Studio Toolbar using the following procedure.
Step 1
Open Visual Studio and create a new web application. Open the toolbar and right-click on it.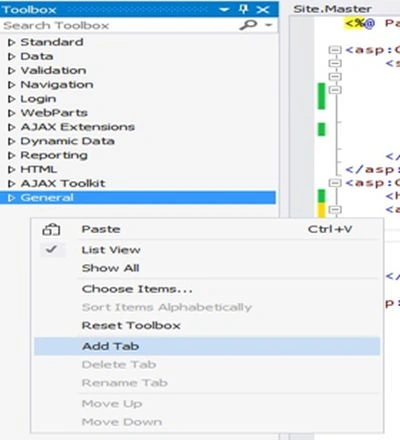
Step 2
Select the Add Tab and give the name “ZedGraph Controls ”. Now right-click on that tab.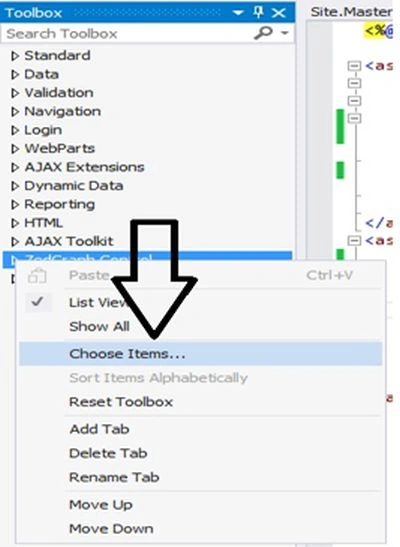
Step 3
Select Choose Items. Then the following window appears.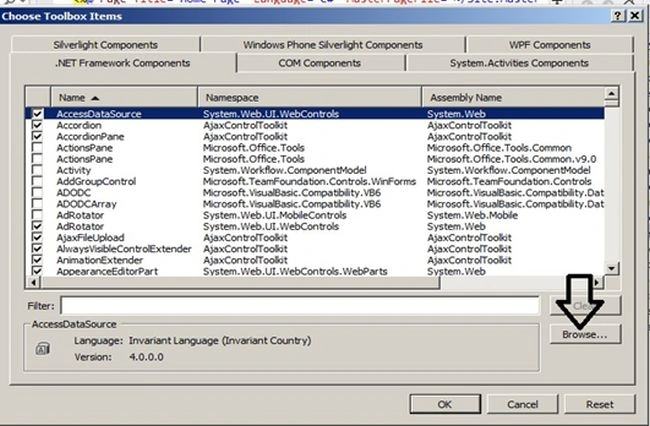
Step 4
Click Browse and select the Zed Graph DLL path and select it.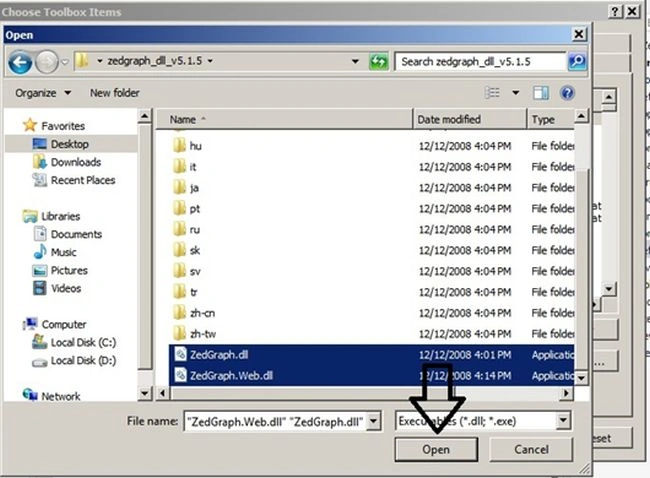
Step 5
Select Open then click OK and continue. Now the ZedGraph controls have been added to your toolbar.
Step 6
Then you also need to copy one image DLL and paste it into your project. You can download that image file from the source code and name it “ZedGraphImages”.
Step 7
Check in the reference tab, the following two references are added but if not and it is missing then add it again by selecting the ZedGraph DLL.
- ZedGraph
- ZedGraph.Web
Step 8
Drag and drop a DropDownList toolbar and add some list items as in the following:
- <asp:DropDownList ID="ddlChartType" runat="server" Height="25px" Width="171px" AutoPostBack="True">
- <asp:ListItem>Select Chart Type..</asp:ListItem>
- <asp:ListItem>Clustered Column</asp:ListItem>
- <asp:ListItem>Stacked</asp:ListItem>
- <asp:ListItem>Line</asp:ListItem>
- <asp:ListItem>Pie</asp:ListItem>
- </asp:DropDownList>
Step 9
Drag and drop a ZedGraphWeb from the toolbar. When you drop it to the page it will add the following reference and some code on the page automatically.
- <%@ Register Assembly="ZedGraph.Web" Namespace="ZedGraph.Web" TagPrefix="manish" %>
- <manish:ZedGraphWeb ID="ZedGraphWeb1" runat="server"></manish:ZedGraphWeb>
Now create a class that will communicate with the database and call the Stored Procedure for displaying the chart.
- public class Configuration
- {
- internal static string connectionString = ConfigurationManager.ConnectionStrings["DbCS"].ConnectionString;
- }
- public class DbOperation
- {
- private void selectData(string StoredProcedureName, out DataTable dtemp, [Optional] string[,] aryParameters)
- {
- using (SqlConnection con = new SqlConnection(Configuration.connectionString))
- {
- using (SqlCommand cmd = new SqlCommand())
- {
- con.Open();
- cmd.CommandType = CommandType.StoredProcedure;
- SqlDataAdapter adp = new SqlDataAdapter();
- DataTable dt = new DataTable();
- cmd.CommandText = StoredProcedureName;
- cmd.CommandTimeout = 300;
- try
- {
- for (int i = 0; i < aryParameters.GetLength(0); i++)
- {
- cmd.Parameters.Add(new SqlParameter(aryParameters[i, 0], aryParameters[i, 1]));
- }
- }
- catch (Exception ex)
- {
- }
- cmd.Connection = con;
- adp.SelectCommand = cmd;
- adp.Fill(dt);
- con.Close();
- dtemp = dt;
- }
- }
- }
- public DataTable MarksDetails()
- {
- DataTable dt = new DataTable();
- selectData("SpStudentInfo", out dt, null);
- return dt;
- }
- }
Now go to the code behind of the web form and write some code and a function.
Note: For displaying the Zed Graph we need to use the following method of ZedGraph.
this.ZedGraphWeb1.RenderGraph += new ZedGraph.Web.ZedGraphWebControlEventHandler(this.OnRenderZedGraph);
And call this method to the OnInit method of your web page.
Step 12
The code structure of your code behind will be as follows.
- #region ZedGraphWeb Display
- override protected void OnInit(EventArgs e)
- {
- // This call is required by the ASP.NET Web Form Designer.
- InitializeComponent();
- base.OnInit(e);
- }
- /// <summary>
- /// Required method for Designer support - do not modify
- /// the contents of this method with the code editor.
- /// </summary>
- private void InitializeComponent()
- {
- this.ZedGraphWeb1.RenderGraph += new ZedGraph.Web.ZedGraphWebControlEventHandler(this.OnRenderZedGraph);
- }
- #endregion
- ClusteredColumnsChartDisplay: For displaying a Clustered Columns Chart.
- StackedChartDisplay: For displaying a Stacked Chart.
- LineChartDisplay: For displaying a Line Chart.
- PieChartDisplay: For displaying a Pie Chart.
Function Structure
- private void OnRenderZedGraph(ZedGraph.Web.ZedGraphWeb z, System.Drawing.Graphics g, ZedGraph.MasterPane masterPane)
- {
- switch (ddlChartType .SelectedItem .Text )
- {
- case "Select Chart Type..":
- ZedGraphWeb1.Visible = false;
- break;
- case "Clustered Column":
- ClusteredColumnsChartDisplay(masterPane, g);
- break;
- case "Stacked":
- StackedChartDisplay(masterPane, g);
- break;
- case "Line":
- LineChartDisplay(masterPane, g);
- break;
- case "Pie":
- PieChartDisplay(masterPane, g);
- break;
- }
- }
For creating a chart we basically need two columns, one will represent the x-axis and the other will represent the y-axis. The same is required with the ZedGraph chart also.
Note: For showing y-axis data in ZedGraph only double data array is needed.
Step 14
Write the following function to create a Clustered Columns Chart.
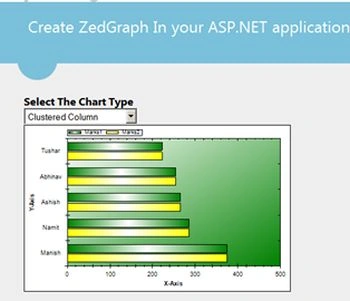
- void ClusteredColumnsChartDisplay(ZedGraph.MasterPane masterPane, System.Drawing.Graphics g)
- {
- GraphPane myPane = masterPane[0];
- // Set the title and axis labels
- myPane.XAxis.Title.Text = "X-Axis";
- myPane.YAxis.Title.Text = "Y-Axis";
- DataTable dt = new DataTable();
- DbOperation db = new DbOperation();
- dt = db.MarksDetails();
- string[] x0 = new string[dt.Rows.Count];
- double[] y0 = new double[dt.Rows.Count];
- for (int i = 0; i < dt.Rows.Count; i++)
- {
- x0[i] = dt.Rows[i]["Name"].ToString();
- y0[i] = Convert.ToDouble(dt.Rows[i]["Total Marks"]);
- }
- // Declare a BarItem:- Bar Item is used for creating a bar
- BarItem myCurve;
- // Generate a blue bar with "Marks1" in the legend
- myCurve = myPane.AddBar("Marks1", y0, null, Color.Green);
- // Fill the bar with a Blue-white-Blue color gradient for a 3d look
- myCurve.Bar.Fill = new Fill(Color.Green, Color.White, Color.Green, 0f);
- //if you want to drow multiple chat comparing two field then use like that
- // Generate a red bar with "Marks2" in the legend
- myCurve = myPane.AddBar("Marks2", y0, null, Color.Yellow );
- // Fill the bar with a red-white-red color gradient for a 3d look
- myCurve.Bar.Fill = new Fill(Color.Yellow, Color.White, Color.Yellow, 0f);
- // Set the YAxis labels
- myPane.YAxis.Scale.TextLabels = x0;
- // Set the YAxis to Text type
- myPane.YAxis.Type = AxisType.Text;
- // Make the bars horizontal by setting the BarBase to "Y"
- myPane.BarSettings.Base = BarBase.Y;
- // Fill the axis background with a color gradient
- myPane.Chart.Fill = new Fill(Color.White, Color.Green , 45.0F);
- masterPane.AxisChange(g);
- }
Write the following function to create a Stacked Chart.
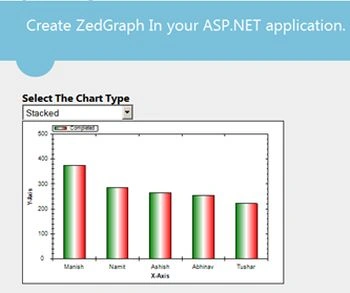
- void StackedChartDisplay(ZedGraph.MasterPane masterPane, System.Drawing.Graphics g)
- {
- GraphPane myPane = masterPane[0];
- // Set the title and axis labels
- myPane.XAxis.Title.Text = "X-Axis";
- myPane.YAxis.Title.Text = "Y-Axis";
- DataTable dt = new DataTable();
- DbOperation db = new DbOperation();
- dt = db.MarksDetails();
- string[] x0 = new string[dt.Rows.Count];
- double[] y0 = new double[dt.Rows.Count];
- for (int i = 0; i < dt.Rows.Count; i++)
- {
- x0[i] = dt.Rows[i]["Name"].ToString();
- y0[i] = Convert.ToDouble(dt.Rows[i]["Total Marks"]);
- }
- // Declare a BarItem:- Bar Item is used for creating a bar
- BarItem myCurve;
- // Generate a blue bar with "Completed" in the legend
- myCurve = myPane.AddBar("Completed", null, y0, Color.Red );
- // Fill the bar with a Blue-white-Blue color gradient for a 3d look
- myCurve.Bar.Fill = new Fill(Color.Green, Color.White, Color.Red, 0f);
- // Set the XAxis labels
- myPane.XAxis.Scale.TextLabels = x0;
- // Set the XAxis to Text type
- myPane.XAxis.Type = AxisType.Text;
- // Make the bars Vertical by setting the BarBase to "X"
- myPane.BarSettings.Base = BarBase.X;
- masterPane.AxisChange(g);
- }
Write the following function to create a Line Chart.
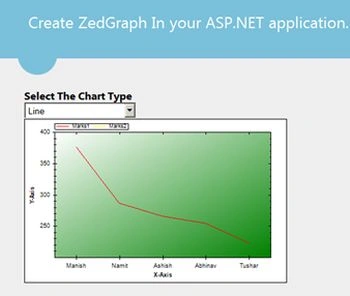
- void LineChartDisplay(ZedGraph.MasterPane masterPane, System.Drawing.Graphics g)
- {
- GraphPane myPane = masterPane[0];
- // Set the title and axis labels
- myPane.XAxis.Title.Text = "X-Axis";
- myPane.YAxis.Title.Text = "Y-Axis";
- DataTable dt = new DataTable();
- DbOperation db = new DbOperation();
- dt = db.MarksDetails();
- string[] x0 = new string[dt.Rows.Count];
- double[] y0 = new double[dt.Rows.Count];
- for (int i = 0; i < dt.Rows.Count; i++)
- {
- x0[i] = dt.Rows[i]["Name"].ToString();
- y0[i] = Convert.ToDouble(dt.Rows[i]["Total Marks"]);
- }
- // Declare a LineItem:- LineItem is used for creating a line
- LineItem oLineItem;
- oLineItem = myPane.AddCurve("Marks1", y0, y0, Color.Red, SymbolType.None);
- //if you want to drow multiple chat comparing two field then use like that
- oLineItem = myPane.AddCurve("Marks2", y0, y0, Color.Yellow , SymbolType.None);
- // Set the XAxis labels
- myPane.XAxis.Scale.TextLabels = x0;
- // Set the YAxis to Text type
- myPane.XAxis.Type = AxisType.Text;
- // Draw the X tics at the labels
- myPane.XAxis.MajorTic.IsBetweenLabels = false;
- // Fill the axis background with a color gradient
- myPane.Chart.Fill = new Fill(Color.White, Color.Green , 45.0F);
- masterPane.AxisChange(g);
- }
Write the following function to create a Pie Chart.
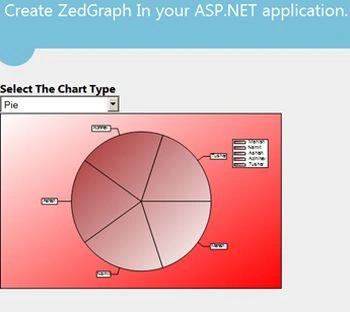
- void PieChartDisplay(ZedGraph.MasterPane masterPane, System.Drawing.Graphics g)
- {
- GraphPane myPane = masterPane[0];
- // Set the title and axis labels
- myPane.XAxis.Title.Text = "X-Axis";
- myPane.YAxis.Title.Text = "Y-Axis";
- DataTable dt = new DataTable();
- DbOperation db = new DbOperation();
- dt = db.MarksDetails();
- string[] x0 = new string[dt.Rows.Count];
- double[] y0 = new double[dt.Rows.Count];
- for (int i = 0; i < dt.Rows.Count; i++)
- {
- x0[i] = dt.Rows[i]["Name"].ToString();
- y0[i] = Convert.ToDouble(dt.Rows[i]["Total Marks"]);
- }
- myPane.Fill = new Fill(Color.White, Color.Red, 45.0f);
- // No fill for the chart background
- myPane.Chart.Fill.Type = FillType.None;
- // Set the legend to an arbitrary location
- myPane.Legend.Position = LegendPos.Float;
- myPane.Legend.Location = new Location(0.95f, 0.15f, CoordType.PaneFraction, AlignH.Right, AlignV.Top);
- myPane.Legend.FontSpec.Size = 10f;
- // IsHStack is use the create the legend items horizontally
- myPane.Legend.IsHStack = false;
- // Add some pie slices
- for (int i = 0; i < y0.Length; i++)
- {
- PieItem segment1 = myPane.AddPieSlice(y0[0], Color.Brown, Color.White, 45f, 0, x0[i]);
- }
- masterPane.AxisChange(g);
- // There is no need for pie chart to adjust X and Y axis. So the rest of the code is irrelavent with regard to Pie Chart
- }
Now the coding is over, compile and run the project to see the output that will be like the following.
- Clustered Columns Chart
- Stacked Chart
- Line Chart
- Pie Chart
Note: For this application I am using the following table and Stored Procedure.
tblStudentInfo
- CREATE TABLE [dbo].[tblStudentInfo](
- [Id] [int] IDENTITY(1,1) NOT NULL,
- [Name] [varchar](50) NOT NULL,
- [Sub1] [int] NOT NULL,
- [Sub2] [int] NOT NULL,
- [Sub3] [int] NOT NULL,
- [Sub4] [int] NOT NULL,
- CONSTRAINT [PK_tblStudentInfo] PRIMARY KEY CLUSTERED
- (
- [Id] ASC
- )WITH (PAD_INDEX = OFF, STATISTICS_NORECOMPUTE = OFF, IGNORE_DUP_KEY = OFF, ALLOW_ROW_LOCKS = ON, ALLOW_PAGE_LOCKS = ON) ON [PRIMARY]
- ) ON [PRIMARY]
And a Stored Procedure SpStudentInfo calculates the student-wise sum of their marks that I will display in the chart.
- in chart.
- USE [manishDB]
- GO
- /****** Object: StoredProcedure [dbo].[SelectAllStudent] Script Date: 11/26/2014 22:26:13 ******/
- SET ANSI_NULLS ON
- GO
- SET QUOTED_IDENTIFIER ON
- GO
- Create PROCEDURE [dbo].[SpStudentInfo]
- AS
- Begin
- select Top 10 Name,Sub1 +Sub2 +Sub3 +Sub4 "Total Marks"
- from tblStudentInfo
- End
In this illustration you came to understand the various types of ZedGraph Chart in ASP.NET.
Manish Kumar ChoudharyPosted Jan 20, 2015, 12:31 AM
Thanks Dinesh Beniwal sir..
Sibeesh VenuPosted Jan 20, 2015, 12:17 AM
Congrats Manish Kumar Choudhary
Dinesh BeniwalPosted Jan 20, 2015, 12:15 AM
Congrats Manish Kumar Choudhary Article of the day on Asp.Net