Statistics: Measure of Central Tendency
Introduction
In the previous chapter, we started with statistics.
In this chapter, we will continue our discussion and talk about the measure of central tendency, i.e. mean, mode, and median.
Measure of Central Tendency
Data is all over, but that data may be distorted or skewed. There are very few chances to get sorted or normalized data. To use this data for work, we need to convert it into our desired form.
To convert it into the desired form we employ the process of measuring the central tendency

Central tendency
A measure of central tendency is a summary statistic that has been drawn from the dataset which represents the center point of the dataset. It is the single value that can be used to describe the dataset by locating or identifying the central position in the data.
These measures indicate where most of the values in the distribution of the data fall and they are also called the central location of the distribution. It is the tendency to cluster around middle values.
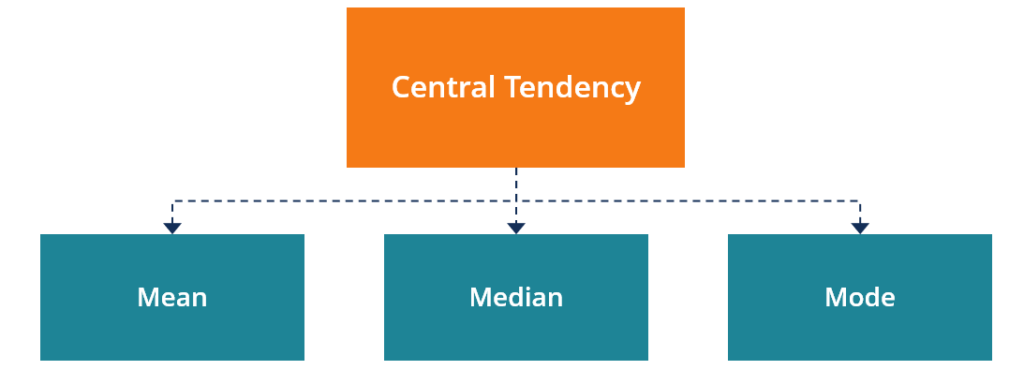
There are three major methods of central tendency i.e. mean, median, and mode.
Mean
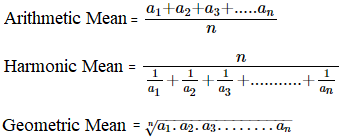
Mean or average is one of the well-known methods of calculation of central tendency. It can be used by both continuous and discrete datasets. We have discussed both in the dataset in the previous section of the article. Mean is equal to the sum of data values divided by the size or the number of values in the dataset.

Mean can be of a different type as well:
- Arithmetic mean
The arithmetic mean is the average of numbers: a calculated "central" value of a set of numbers.
- Geometric mean
The geometric mean is a special type of average where we multiply the numbers together and then take the square root (for two numbers), cube root (for three numbers), etc.It gives us a way of finding value in between widely different values.It is useful when we want to compare things or values.
- Harmonic mean
It is one of several kinds of averages, and in particular, one of the Pythagorean means.It is appropriate for the situation when the average of rates is desired. Harmonic mean can be expressed as the reciprocal of the arithmetic mean of the reciprocal of the given set of the observation.

Median
Median is the middle score for a set of data that has been arranged in order of magnitude. It is less affected by the outliers and skewed data.
It works fine for odd numbers of data. For even numbers of data, we add the middle two values and take their average.

Mode
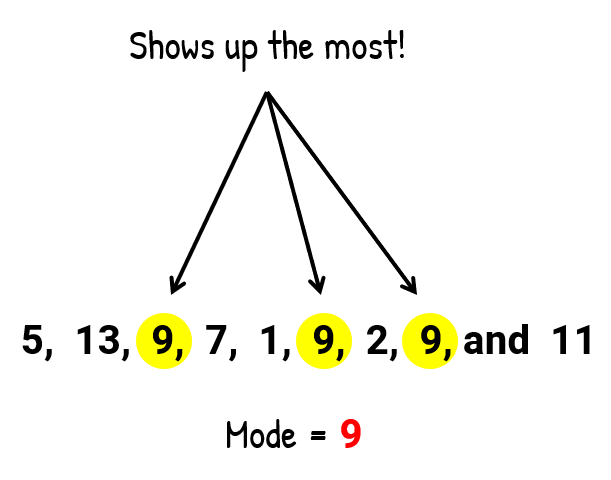
It is the most frequent score in our dataset.
On a histogram, it represents the highest bar in a bar chart or histogram. It is sometimes considered as being the most popular option.
It is used for categorical data when we want to know the most common category.

It is problematic when we have continuous data since we are not likely to have any value more frequently than another.
Now the question arises of when to use which method. So, I am providing a summary of the variables and the best-practice centralizing method to work with.
Type of Variable - Best Measure of Central Tendency
| Type of Data | Best Measure of Central Tendency |
| Small or Nominal | Mode |
| Large or Ordinal | Median |
| Interval/Ratio(not skewed) | Mean |
| Interval/Ratio(skewed) | Median |
Conclusion
In this chapter, we learned about the measure of central tendency in statistics. In the next chapter, we will study about data science, which intends to convert data into a desired form.
Author
Yukta Ranka
0
690
46.4k
