Machine Learning: K-Means Clustering
Introduction
In the previous chapter, you studied Multiple Linear Regression.
In this chapter, we will study Multiple Linear Regression.
Note: if
you can correlate anything with yourself or your life, there are greater chances of understanding the concept. So try to understand everything by relating it to humans.
What is k-Means Clustering?
k-means algorithm is an iterative algorithm that tries to partition the dataset into 'k' pre-defined distinct non-overlapping subgroups or clusters where each data point belongs to only one group. It tries to make the inter-cluster data points as similar as possible while also keeping the clusters as different or as far as possible. It assigns data points to a cluster such that the sum of the squared distance between the data points and the cluster’s centroid is at the minimum. The less variation we have within clusters, the more homogeneous the data points are within the same cluster.
Why k-Means Clustering?
- K-means converges in a finite number of iterations. Since the algorithm iterates a function whose domain is a finite set, the iteration must eventually converge.
- The computational cost of the k-means algorithm is O(k*n*d), where n is the number of data points, k the number of clusters, and d the number of attributes.
- Compared to other clustering methods, the k-means clustering technique is fast and efficient in terms of its computational cost.
- It’s difficult to predict the optimal number of clusters or the value of k. To find the number of clusters, we need to run the k-means clustering algorithm for a range of k values and compare the results.
What is meant by Clustering?
Clustering is the task of dividing the population or data points into a number of groups such that data points in the same groups are more similar to other data points in the same group and dissimilar to the data points in other groups.
Types of Clustering
1. Centroid-based Clustering
2. Density-based Clustering
3. Distribution-based Clustering
4. Hierarchical Clustering
Difference between Clustering and Regression
| Parameter | CLASSIFICATION | CLUSTERING |
| Type | Supervised Learning | Unsupervised Learning |
| Description | Process of classifying the input instances based on their corresponding class labels | Grouping the instances based on their similarity without the help of class labels |
| The necessity of Training and Testing Dataset | It has labels so there is a need for training and testing dataset for verifying the model created | There is no need for training and testing dataset |
| Complexity | More complex as compared to clustering | Less complex as compared to the classification |
| Example Algorithms | Logistic regression, Naive Bayes classifier, Support vector machines, etc. | k-means clustering algorithm, Fuzzy c-means clustering algorithm, Gaussian (EM) clustering algorithm, etc. |
Why is k-Means clustering nondeterministic?
The basic k-means clustering is based on a non-deterministic algorithm. This means that running the algorithm several times on the same data could give different results, i.e. it may be possible that the centroid value for a given class may come out to be different at different instances of time for the same dataset.
For instance, at a given instance we took D1 and D2 to find the centroid and then we took D1 and D5, the value of centroid will change, hence the resulting model will change
How does k-Means clustering work?
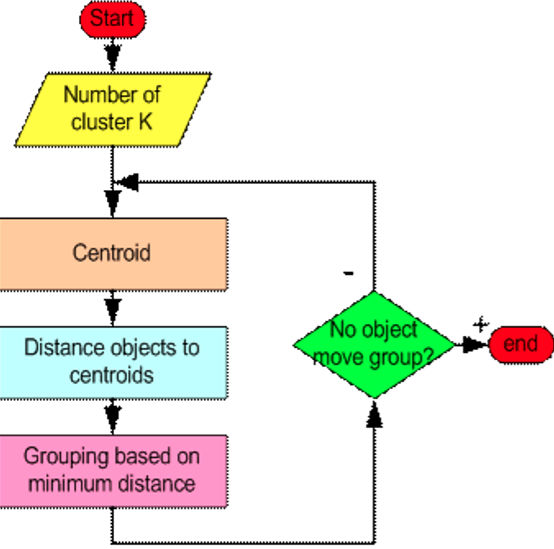
Step 1
Begin with a decision on the value of k = number of clusters.
Step 2
Put any initial partition that classifies the data into k clusters. You may assign the training samples randomly, or systematically as the following:
1. Take the first k training sample as single- element clusters
2. Assign each of the remaining (N-k) training samples to the cluster with the nearest centroid. After each assignment, recompute the centroid of the gaining cluster.
Step 3
Take each sample in sequence and compute its distance from the centroid of each of the clusters. If a sample is not currently in the cluster with the closest centroid, switch this sample to that cluster and update the centroid of the cluster gaining the new sample and the cluster losing the sample.
Step 4
Repeat step 3 until convergence is achieved, that is until a pass through the training sample causes no new assignments.
What are Centroids?
In mathematics and physics, the centroid or geometric center of a plane figure is the arithmetic mean position of all the points in the figure. Informally, it is the point at which a cutout of the shape could be perfectly balanced on the tip of a pin.
What are Centroids in k-Means?
The k-means clustering algorithm attempts to split a given anonymous data set (a set containing no information as to class identity) into a fixed number (k) of clusters.
Initially, the k number of so-called centroids are chosen. A centroid is a data point (imaginary or real) at the center of a cluster. Each centroid is an existing data point in the given input data set, picked at random, such that all centroids are unique (that is, for all centroids ci and cj, ci ≠ cj).
These centroids are used to train a classifier. The resulting classifier is used to classify (using k = 1) the data and thereby produces an initial randomized set of clusters. Each centroid is thereafter set to the arithmetic mean of the cluster it defines. The process of classification and centroid adjustment is repeated until the values of the centroids stabilize. The final centroids will be used to produce the final classification/clustering of the input data, effectively turning the set of initially anonymous data points into a set of data points, each with a class identity.
k-Means using an Example
Let's try to understand k-means using a mathematical example. Given the following dummy dataset with two clusters A and B.
Iteration 1
| Data Points | X-axis | Y-axis |
| D1 | 2 | 0 |
| D2 | 1 | 3 |
| D3 | 3 | 5 |
| D4 | 2 | 2 |
| D5 | 4 | 6 |
Let's start by finding the Euclidean Distance given by the formula: √((x1-y1)² + (x2-y2)²
Distance between D1 and D2 : √((2-1)² + (0-3)²
= √((1)² + (3)²
= √(10)
= 3.17
Distance between D1 and D4 : √((2-2)² + (0-2)²
= √((0)² + (-2)²
= √(4)
= 2
Similarly, let us find the distance between other points
| Data Points | Distance between D2 and other data points | Distance between D4 and other data points |
| D1 | 3.17 | 2.0 |
| D3 | 2.83 | 3.17 |
| D5 | 4.25 | 4.48 |
Seeing the above data, we can form the following two groups
Cluster 1: D1, D4
Cluster 2: D2, D3, D5
Now our next step is to find the mean values and the new centroid values with respect to the corresponding to the centroid values
| Data Points | Mean value of data points along the x-axis | Distance between D4 and other data point |
| D1, D4 | 2.0 | 1.0 |
| D2, D3, D5 | 2.67 | 4.67 |
Hence the centroid values are
Cluster 1: (2.0, 1.0)
Cluster 2: (2.67, 4.67)
Iteration 2
Based on the above data, we again calculate the euclidean distance for the new centroids.
| Data Points | Distance between D2 and other data points | Distance between D4 and other data points |
| D1 | 1.0 | 4.72 |
| D2 | 2.24 | 2.37 |
| D3 | 4.13 | 0.47 |
| D4 | 1 | 2.76 |
| D5 | 5.39 | 1.89 |
From the above data, we infer the following
Cluster 1: (D1, D2, D4)
Cluster 2: (D3, D5)
Since the clusters have changed so we will now calculate the mean values again and the corresponding centroid values
| Data Points | Mean value of data points along the x-axis | Distance between D4 and other data point |
| D1, D2, D4 | 1.67 | 1.67 |
| D3, D5 | 3.5 | 5.5 |
So now the centroid values are:
Cluster 1: (1.67, 1.67)
Cluster 2: (3.5, 5,5)
The above process has to be repeated until we find a constant value for centroids and the latest cluster will be considered as the final cluster solution.
Python Implementation of K-Means Clustering
I have used Google Colab to run and test my code, you can use any of the IDEs or development environments. Feel
free to use any dataset,
there some very good datasets available on kaggle and with Google Colab.
1. Using functions
In this, I will be using some dummy data, you can use any data, that you want.
- # Importing the required libraries
- import matplotlib.pyplot as plt
- from matplotlib import style
- style.use('ggplot')
- import numpy as np
- #Dummy data
- X = np.array([[1, 2],
- [1.5, 1.8],
- [5, 8 ],
- [8, 8],
- [1, 0.6],
- [9,11],
- [1,3],
- [8,9],
- [0,3],
- [5,4],
- [6,4],
- [1,2],
- [2,4],
- [11,5],
- [2.56,5.6],
- [2, 2],
- [1.8, 1.8],
- [8, 8 ],
- [5, 5],
- [0.6, 0.6],
- [11,11],
- [3,3],
- [9,9],])
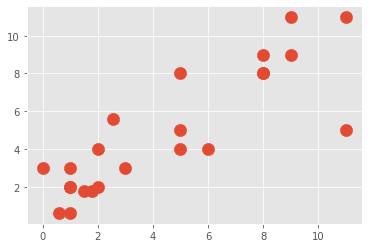
- #Plot of the Dummy Data
- plt.scatter(X[:,0], X[:,1], s=150)
- plt.show()
- #Defining the colors that can be used in plots
- colors =["g","r","c","b","k"]
- #Defination of the class K_Means
- #Using this class we are implementing all the steps required
- #to be performed to generate a k-means model
- class K_Means:
- def __init__(self, k=5, tol=0.001, max_iter=300):
- self.k = k
- self.tol = tol
- self.max_iter = max_iter
- #Function to fit the dummy mode on to the model
- def fit(self,data):
- self.centroids = {}
- for i in range(self.k):
- self.centroids[i] = data[i]
- for i in range(self.max_iter):
- self.classifications = {}
- for i in range(self.k):
- self.classifications[i] = []
- for featureset in data:
- distances = [np.linalg.norm(featureset-self.centroids[centroid]) for centroid in self.centroids]
- classification = distances.index(min(distances))
- self.classifications[classification].append(featureset)
- prev_centroids = dict(self.centroids)
- for classification in self.classifications:
- self.centroids[classification] = np.average(self.classifications[classification],axis=0)
- optimized = True
- for c in self.centroids:
- original_centroid = prev_centroids[c]
- current_centroid = self.centroids[c]
- if np.sum((current_centroid-original_centroid)/original_centroid*100.0) > self.tol:
- np.sum((current_centroid-original_centroid)/original_centroid*100.0)
- optimized = False
- if optimized:
- break
- #Function to generate prediction result
- def predict(self,data):
- distances = [np.linalg.norm(data-self.centroids[centroid]) for centroid in self.centroids]
- classification = distances.index(min(distances))
- return classification
- clf = K_Means()
- clf.fit(X)
- #putting the centroid values on to the plot
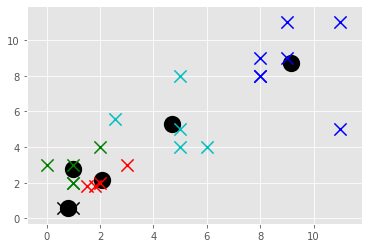
- for centroid in clf.centroids:
- plt.scatter(clf.centroids[centroid][0], clf.centroids[centroid][1],
- marker="o", color="k", s=150, linewidths=5)
- for classification in clf.classifications:
- color = colors[classification]
- for featureset in clf.classifications[classification]:
- plt.scatter(featureset[0], featureset[1], marker="x", color=color, s=150, linewidths=5)
- #Priting the centroid values
- for centroid in clf.centroids:
- print(clf.centroids[centroid][0],clf.centroids[centroid][1])
- plt.show()
The centroid values I am getting are:
1.0 2.8
2.075 2.15
4.712 5.32
9.142857142857142 8.714285714285714
0.8 0.6
2. Using Sklearn
Here I am using dummy data, you can use any dataset of your choice.
- # importing all the required libraries
- import matplotlib.pyplot as plt
- %matplotlib inline
- import numpy as np
- from sklearn.cluster import KMeans
- #dummy data
- X = np.array([[1, 2],
- [1.5, 1.8],
- [5, 8 ],
- [8, 8],
- [1, 0.6],
- [9,11],
- [1,3],
- [8,9],
- [0,3],
- [5,4],
- [6,4],
- [1,2],
- [2,4],
- [11,5],
- [2.56,5.6],
- [2, 2],
- [1.8, 1.8],
- [8, 8 ],
- [5, 5],
- [0.6, 0.6],
- [11,11],
- [3,3],
- [9,9],])
- #plotting the dummy data
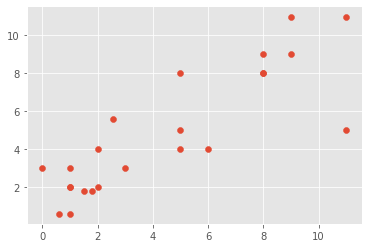
- plt.scatter(X[:,0],X[:,1], label='True Position')
- plt.show()
- #creating the object of sklearn.cluster.KMeans class
- #Passed the number of clusters value to be 3, i.e. we are making a 3-Means clustering model
- kmeans = KMeans(n_clusters=3)
- #passing the data to the model
- kmeans.fit(X)
- #printing the centroid values
- print(kmeans.cluster_centers_)
- #Printing the predicted values
- print(kmeans.labels_)
- #Plotting the data based upon their predicted cluster
- plt.scatter(X[:,0],X[:,1], c=kmeans.labels_, cmap='rainbow')
- plt.show()
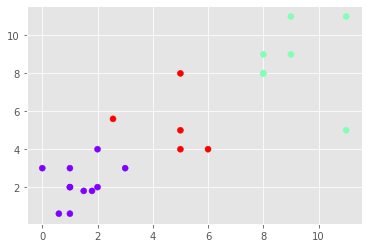
The output that I got is
Centroids:
[[1.35454545 2.16363636]
[9.14285714 8.71428571]
[4.712 5.32 ]]
Points classified into classes:
[0 0 2 1 0 1 0 1 0 2 2 0 0 1 2 0 0 1 2 0 1 0 1]
3. Using TensorFlow
Here I am using dummy data, you can use any dataset that you wish to use.
- #importing the required libraries
- import matplotlib.pyplot as plt
- import numpy as np
- import tensorflow as tf
- points_n = 200 #number of data points
- clusters_n = 3 #number of classes in which points needs to be classifies
- iteration_n = 100 #epoch value
- #initializing the placehlders
- points = tf.constant(np.random.uniform(0, 10, (points_n, 2)))
- centroids = tf.Variable(tf.slice(tf.random_shuffle(points), [0, 0], [clusters_n, -1]))
- points_expanded = tf.expand_dims(points, 0)
- centroids_expanded = tf.expand_dims(centroids, 1)
- #Creation of tensor to hold the euclidean disatnce formula
- distances = tf.reduce_sum(tf.square(tf.subtract(points_expanded, centroids_expanded)), 2)
- assignments = tf.argmin(distances, 0)
- #logic to generate the model
- means = []
- for c in range(clusters_n):
- means.append(tf.reduce_mean(
- tf.gather(points,
- tf.reshape(
- tf.where(
- tf.equal(assignments, c)
- ),[1,-1])
- ),reduction_indices=[1]))
- new_centroids = tf.concat(means, 0)
- update_centroids = tf.assign(centroids, new_centroids)
- init = tf.global_variables_initializer()
- #session to execute the logic and generate the model
- with tf.Session() as sess:
- sess.run(init)
- for step in range(iteration_n):
- [_, centroid_values, points_values, assignment_values] = sess.run([update_centroids, centroids, points, assignments])
- #to print the centroid values
- print("centroids", centroid_values)
- #plotting of the dummy data with centroid values
- plt.scatter(points_values[:, 0], points_values[:, 1], c=assignment_values, s=50, alpha=0.5)
- plt.plot(centroid_values[:, 0], centroid_values[:, 1], 'kx', markersize=15)
- plt.show()
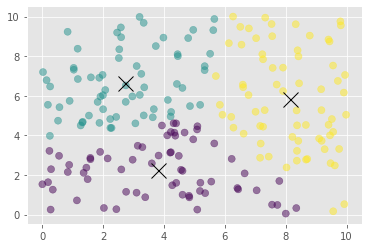
Centroids:
[[3.81697836 2.2322892 ]
[2.72036385 6.65968922]
[8.123787 5.82232576]]
Conclusion
In this chapter, we studied k-means clustering.
In the next chapter, we will study KNN i.e. k-nearest neighbors.
Author
Rohit Gupta
22
53.3k
3.2m
