Design Environment
SAP Crystal Report design gives an environment where we can design our report according to our requirement. In the SAP Crystal Report we use some steps for designing.
Report Design Canvas
This designing is used to design the architecture of the report. Some more features like - charts, test elements etc. It can be inserted by Report Design Canvas. We see a ruler line, here. Change the unit of the measurement by changing the measurement unit option, placed on design canvas tab.
Go to Edit → Preference → Design Canvas
Here, we can see mainly two types of mode,
- Structure mode
- Page mode
We use Structure mode to give a designing environment to our report. It provides a structure and instructions for creating the report. We can easily add/delete the data in the Structure mode. When we make any changes in the report, it is shown in Structure mode.
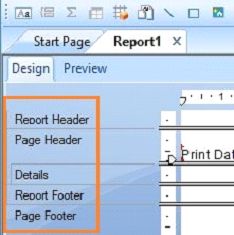
Each object in Structure mode is represented by a frame. Structure mode has multiple components, which can be used to edit the report .
Report Header
With the help of this option, we add report title, placed at the top or other information, according to our report requirement.
Page Header
With the help of this option, we can show the data, placed at the top of each page of the report like document heading etc.
Body
With the help of this option, we show the body of the report.
Report Footer
With the help of this option, we show the data at the end of the report like totals etc.
Page Footer
With the help of this option, we show the page numbers or other information on each page, according to our report requirement.
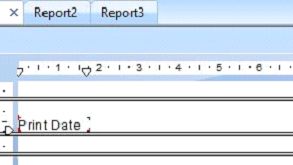
Page Mode
Page Mode shows the real data in the report. It is used, when the report is produced or printed. We can also use this change in designing of the report with the original data.
Data Explorer Side Bar
In Data Explorer Side Bar, we can use this feature to add or delete the data in the report. All the data, which we insert in the query are shown in Data Explorer. We easily create a new report or open a report in this tab easily. Data Explorer Side Bar is divided into some parts,
Result Objects
With the help of this option, we show all the data, which we add in the report. If we want to insert the data in the report, we can add the object. Edit Data Sources allows us to insert new data from the Universe.
Formula
With the help of this option, we show all the formula, which we created in our report.
Parameters
With the help of this option, we show all the parameters, which we use in our report.
Running Totals
With the help of this option, we show a list of all running totals, which we use in our report.
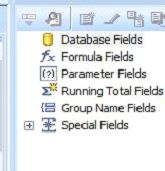
Predefined Objects
With the help of this option, we show the predefined objects, which can be inserted in a report, as shown below,
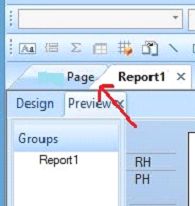
Group Tree
With the help of this option, we see tree view of all groups(reports) and subgroups in the report.
Find
With the help of this option, we search a particular data in the report.
Summary
Thus, we learned that design environment allows creating designing in Crystal Report.