Greetings,
have bind chart successfully.
Requirement :
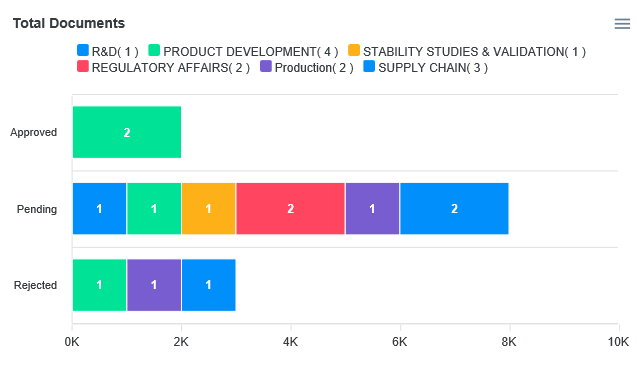
Want to show bar department wise , it means department position will go to status position (approve,pending and reject )
and status position will go to department ( below image is for reference )
Solution Required: legend position will show status which is Approve/pending and reject and status position will show department,
each depart has its own bar which shows complete its staus like approve/pending and rejected.

My code:
if (response.d.length > 0) {
var dataarray = [];
var datapending = [];
var datareject = [];
var datalabel = ['Approved', 'Pending', 'Rejected'];
// var test='10,4,3,8';
var dataapproved = []
console.log(dataarray);
for (var i = 0; i < response.d.length; i++) {
console.log(response.d[i].DepartName);
dataarray.push({ name: response.d[i].DepartName + '( ' + response.d[i].totaldocs + ' )', data: [response.d[i].pendingdocs, response.d[i].approveddocs, response.d[i].rejecteddocs] });
//dataarray.push({name:'Approved,' data:response.d[i].approveddocs});
datapending.push({name:'Pending', data: [response.d[i].pendingdocs]});
datareject.push({ data: [response.d[i].rejecteddocs] });
}
new Vue({
el: '#app',
components: {
apexchart: VueApexCharts,
},
data: {
series:dataarray,
chartOptions: {
chart: {
type: 'bar',
height: 350,
stacked: true,
},
plotOptions: {
bar: {
horizontal: true,
},
},
stroke: {
width: 1,
colors: ['#fff']
},
title: {
text: 'Total Documents'
},
xaxis: {
categories:datalabel ,
labels: {
formatter: function (val) {
return val + "K"
}
}
},
yaxis: {
title: {
text: undefined
},
},
tooltip: {
y: {
formatter: function (val) {
return val + "K"
}
}
},
fill: {
opacity: 1
},
legend: {
nbsp; horizontalAlign: 'left',
offsetX: 40
}
},
},