

Developer dashboard is one of the coolest feature in SharePoint 2010 and loved
by the developer community. Developer dashboard can help in diagnosing various
issues in a custom code.
Counters in developer dashboard
Per-Thread counters
Gives the following information of current thread with actual values
- Execution Time
- SPRequests Allocated
- Number of SQL queries performed
- Duration of SQL query
- Query Text
- URL
- Current User
- Start Time
Pre-Process counters
- Global Heap Size
- Total size of all native heaps
- Native heap count
- Active native heap count
- Count of sharepoint operation in progress
Client Counters
- Page Size
System Counter
- Machine's available memory
- Hard Page faults
- Processor Utilization
- Heap size of managed memory
How to use Monitor in Code?
Monitoring code is easy very easy with help of developer dashboard. First thing
identify the portion of the code need real monitoring and wrap that code
SPMonitorScope.
using
(new
SPMonitoredScope("TestScope"))
{
//Code
which needs to be monitored goes here
}
Another approach implement ISPScopedPerformanceMonitor Interface in your custom
class and use it.
Enabling Developer Dashboard
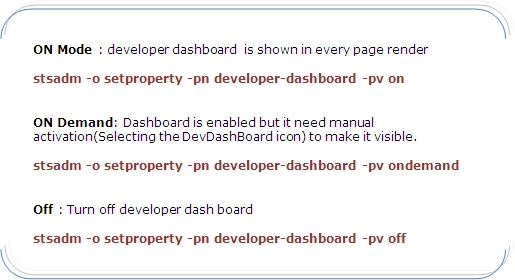
By default Developer Dash Board is disabled so you need to enable it.
STSADM Command
Power shell Command
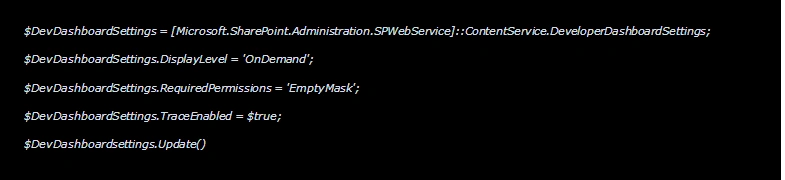
C# Code

Developer Dash Board in a custom Page
<Sharepoint:DeveloperDashboardLauncher
ID="DeveloperDashboardLauncher"
NavigateUrl="javascript:ToggleDeveloperDashboard()"
runat="server"
ImageUrl="/_layouts/images/fgimg.png"
Text="<%$Resources:wss,multipages_launchdevdashalt_text%>"
OffsetX=0
OffsetY=78
Height=16
Width=16 />
<div id="DeveloperDashboard" class="ms-developerdashboard" />
<SharePoint:DeveloperDashboard runat="server" />
Read following articles about the this feature.
Using the Developer Dashboard
http://msdn.microsoft.com/en-us/library/ff512745.aspx
Using SPMonitoredScope
http://msdn.microsoft.com/en-us/library/ff512758.aspx
SapnaPosted Feb 9, 2011, 11:18 PM
Very good work and easy to understand.